
InSAR Monitoring: How Interferometric Synthetic Aperture Radar Detects Ground Movement from Space
Every year, millions of people cross bridges, pass through tunnels, and live above ground that is slowly, invisibly sinking. The movement is real — measurable in millimetres — and it often begins years before a crack appears in a wall or a road surface buckles. The problem has never been that the movement does not exist. The problem is that nobody was measuring it.
Interferometric Synthetic Aperture Radar — InSAR — changes that equation entirely. Using radar pulses transmitted from satellites in low Earth orbit, InSAR measures surface deformation across thousands of square kilometres simultaneously, with a precision that reaches one to three millimetres per year. No equipment installed on the ground. No access to the structure. No site visits. And because the Sentinel-1 satellite archive extends back to 2014, the historical record of how a piece of ground has been moving already exists for most of the planet — whether or not anyone has been paying attention to it.
The industries that stand to gain the most from this technology — construction, mining, oil and gas, utilities, transport — are also the ones where undetected ground movement causes the most expensive and dangerous consequences. Our team at SkyIntelGroup processes and interprets InSAR data for clients across all these sectors globally, translating raw radar signals into actionable deformation intelligence without requiring the client to have any expertise in satellite data processing.
What Is InSAR and How Does Radar See Ground Movement
Synthetic Aperture Radar is an active imaging system — unlike optical satellites that depend on sunlight, SAR satellites generate their own microwave pulses and measure what bounces back. Because microwaves pass through clouds, rain, and darkness without interruption, SAR operates continuously regardless of weather or time of day. That alone gives it a fundamental operational advantage over any optical remote sensing technique for monitoring applications that cannot afford gaps in coverage.
The interferometric part of InSAR is where the deformation measurement happens. When a SAR satellite passes over the same location on two separate dates, the radar signal that returns carries information not just about the surface but about the precise distance between the satellite and every point on the ground. That distance is encoded in the phase of the returning wave — a measurement so sensitive that a shift of just a few millimetres in the ground surface changes the phase in a detectable way. By comparing the phase of two images acquired at different times, it is possible to generate an interferogram: a map of how much every point on the surface moved toward or away from the satellite between the two acquisitions.
The visual output of an interferogram is striking — concentric rainbow-coloured fringes, each complete cycle representing approximately 2.8 centimetres of displacement in the satellite’s line of sight for Sentinel-1’s C-band radar. An area of rapid subsidence appears as tightly packed fringes. A stable area shows no pattern at all. The density and shape of those fringes tell a trained analyst where movement is concentrated, how fast it is progressing, and whether it is accelerating.
Compared to GPS monitoring — the technology most people associate with precision ground measurement — InSAR operates at a fundamentally different scale. A GPS station delivers sub-millimetre accuracy at a single point, requiring physical installation, power, and communication infrastructure. InSAR delivers millimetre-scale measurements at hundreds of thousands of points simultaneously across the entire analysis area, with nothing installed anywhere. For portfolio-scale infrastructure monitoring, the difference in practical coverage is not incremental — it is categorical.
| Method | Spatial Coverage | Installation | Historical Data | Precision |
|---|---|---|---|---|
| InSAR / PS-InSAR | Thousands of km² simultaneously | None required | From 2014 (Sentinel-1 archive) | 1–3 mm/year |
| GPS / GNSS | Single point per station | Physical station, power, comms | From installation date only | <1 mm (sub-millimetre) |
| Tiltmeters / Inclinometers | Individual sensor location only | Embedded or surface-mounted | From installation date only | 0.001° angular resolution |
| Levelling Surveys | Survey transects only | Field team, repeated visits | Campaign-dependent | ±1–2 mm per km |
From Raw Radar to Deformation Maps: DInSAR, PS-InSAR and SBAS Explained
The term InSAR describes a family of related techniques that share the same fundamental principle — comparing radar phase across time — but differ significantly in what they are optimised to detect, how many images they require, and what kind of terrain they work best on. Understanding these distinctions matters for anyone commissioning or evaluating InSAR-based monitoring, because the technique selected determines what questions the data can actually answer.
Differential InSAR (DInSAR)
DInSAR is the foundational form of the technique. It uses two SAR images — one before an event and one after — to measure the displacement that occurred between those two dates. DInSAR excels at capturing rapid, large-magnitude deformation: an earthquake that shifts the ground by tens of centimetres, a volcanic inflation event, a landslide that moves metres in a single episode. The output is a single interferogram showing what happened in the interval between the two acquisitions.
The limitation of conventional DInSAR for infrastructure monitoring is its sensitivity to noise sources — primarily atmospheric water vapour, which introduces phase delays that can be misinterpreted as ground movement — and temporal decorrelation, which occurs when the surface character changes between acquisitions (vegetation growth, surface disturbance, snow cover) and the phase comparison becomes unreliable. For monitoring slow, continuous subsidence of a few millimetres per year, DInSAR alone is insufficient. That is where time-series techniques become essential.
Persistent Scatterer InSAR (PS-InSAR)
PS-InSAR processes a long stack of SAR images — typically 20 or more, spanning months to years — and identifies individual pixels that maintain a stable, coherent radar reflection across every acquisition: corners of buildings, rock outcrops, metal structures, bridge decks. These persistent scatterers act as natural reflectors distributed across the analysis area, each providing a continuous time series of displacement measurements.
Because PS-InSAR estimates and removes the atmospheric contribution statistically across the full image stack, it can extract deformation signals at the millimetre-per-year level even when individual interferograms are too noisy to be reliable. This makes it the standard technique for urban infrastructure monitoring, where buildings, bridges, and paved surfaces provide abundant persistent scatterers and the deformation rates of interest — foundation settlement, subsidence, structural movement — are precisely in the millimetre-per-year range. SkyIntelGroup’s infrastructure monitoring services apply PS-InSAR processing to deliver the deformation time series that engineering decisions require. For a detailed explanation of how we apply this to ground movement monitoring specifically, see our subsidence monitoring page.
Small Baseline Subset (SBAS)
SBAS takes a different approach: rather than focusing on individual point scatterers, it processes distributed targets — areas of ground with similar but not identical backscatter characteristics — by using image pairs with short spatial and temporal baselines to maintain coherence. SBAS is particularly effective in semi-urban and agricultural areas where persistent scatterers are sparse but the ground surface maintains sufficient coherence across short time intervals. In practice, PS-InSAR and SBAS are often applied together — PS-InSAR for the urban fabric, SBAS for the surrounding terrain — to maximise spatial coverage across a study area.
How the Processing Chain Turns Phase Data into Actionable Intelligence
From Interferogram to Velocity Map
The processing chain from raw SAR data to a usable deformation product involves several steps that require both technical expertise and careful quality control. Co-registration aligns the two or more images to sub-pixel accuracy. Phase unwrapping converts the cyclically ambiguous interferometric phase (which repeats every 2.8 cm for Sentinel-1) into absolute displacement values. Atmospheric correction removes the spatially correlated phase noise introduced by water vapour variations in the troposphere. The final output — whether from PS-InSAR or SBAS — is a velocity map showing the mean rate of displacement at each measurement point over the analysis period, together with time series showing how that displacement evolved date by date.
It is this final layer — the interpreted velocity map and time series — that SkyIntelGroup delivers to clients, not raw interferograms. The distinction matters: raw InSAR outputs require specialist software and expertise to interpret. What an engineer or asset manager actually needs is a clear answer to the question of whether their asset is moving, at what rate, and whether that rate is changing.
InSAR Applications: Where the Technology Delivers Consequences That Matter
InSAR is not a single-use technology. The same physical principle — measuring how the ground has moved between two radar acquisitions — applies across every industry where ground or structural movement carries financial, safety, or regulatory consequences. What changes from one application to the next is not the technique but the question being asked and the decision the answer needs to support.
Construction and Urban Infrastructure
In urban construction environments, ground movement is both an operational risk and a legal liability. Excavation, deep piling, dewatering, and tunnelling change the stress state of soil over areas that extend well beyond the immediate construction footprint. Buildings, bridges, and buried utilities located tens or even hundreds of metres from the works can experience settlement induced by changes in groundwater pressure or the removal of lateral soil support. Without monitoring data, attributing that movement to a specific construction activity — and defending that attribution in court — is nearly impossible.
PS-InSAR applied to an urban construction corridor provides a pre-construction baseline for every permanent structure within the zone of influence, and then tracks whether those structures move during and after works. The archive data going back to 2014 means that the baseline is not established from the day monitoring starts — it already exists. An engineering firm can review a decade of deformation history for every building on a block before a single pile is driven, identifying structures that were already moving before the project began and separating pre-existing conditions from construction-induced effects. That distinction has direct legal and financial significance.
Post-construction, the same InSAR monitoring confirms whether affected structures have stabilised at their new position or continue to creep — information that matters for project sign-off, insurance assessments, and long-term warranty obligations.
Mining Operations
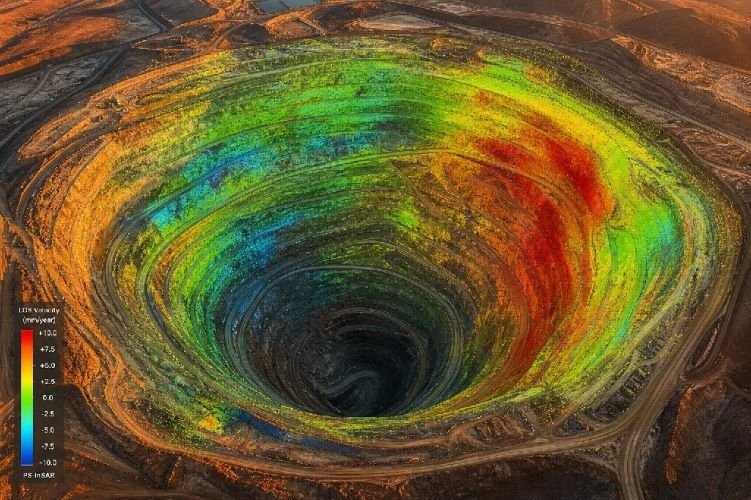
Mining-induced ground movement presents some of the most consequential monitoring challenges in any industry. Open-pit slope failures — where pit wall sections collapse suddenly into the excavation — are among the deadliest events in mining, and the precursor movements that precede them are measurable weeks or months in advance with millimetre-precision deformation data. PS-InSAR applied to the pit walls of an open-pit mine provides continuous coverage of the entire slope inventory, flagging sectors where displacement is accelerating in time to trigger geotechnical intervention before a failure occurs.
Tailings storage facilities present a different but equally serious challenge. Post-Brumadinho, the global mining industry has faced intensifying regulatory pressure to implement rigorous monitoring of tailings dams under the Global Industry Standard on Tailings Management (GISTM). InSAR offers wide-area coverage of dam crests, embankment faces, and surrounding terrain — including the zones between in-situ monitoring instruments that traditional systems leave unobserved. The combination of PS-InSAR and SBAS can monitor a large tailings facility comprehensively, with near-real-time alerts when displacement patterns deviate from established baselines.
Underground mining — longwall coal extraction, block caving, sublevel stoping — produces surface subsidence patterns that affect infrastructure, agricultural land, water resources, and communities located above the workings. DInSAR time series over underground mining areas documents subsidence development in near-real-time, providing mine operators with the data needed to manage surface impacts and meet regulatory reporting requirements.
Oil, Gas and Energy Infrastructure
Hydrocarbon extraction compacts reservoir rock as fluid pressure declines, producing surface subsidence that can reach tens of centimetres per year over active fields. The Permian Basin in Texas, the Po Valley in Italy, and the Groningen gas field in the Netherlands are among the most documented cases, but the phenomenon occurs wherever fluid is extracted at significant rates. InSAR monitoring of producing fields provides reservoir engineers with surface deformation data that correlates with subsurface compaction models, helping optimise extraction strategies and anticipate infrastructure risks before they materialise.
Offshore platforms present a variant of the same problem: the seabed beneath a platform subsides as the reservoir below depletes, altering the structural loads on the platform foundation. PS-InSAR applied to the platform’s radar-reflective superstructure can detect millimetre-scale tilt and differential settlement that ground-based monitoring cannot access cost-effectively.
Pipeline corridors — whether buried or surface — are vulnerable to both ground movement (subsidence, landslides, frost heave) and third-party encroachment. SAR-based change detection over pipeline right-of-way provides continuous surveillance, flagging new construction activity, vegetation changes indicating potential leaks, and terrain movement that threatens pipeline integrity.
Transport Networks and Utilities
Linear infrastructure — railways, motorways, transmission lines, water mains — presents a monitoring challenge that no in-situ sensor network can address economically at full network scale. The cost of instrumenting every bridge, embankment, and culvert on a major rail network would be prohibitive. InSAR changes the monitoring logic from «instrument the assets we know are at risk» to «understand which assets are actually moving across the entire network.»
The operational implications of this shift are significant. A transport authority managing thousands of route kilometres with InSAR monitoring has a continuously updated picture of where deformation is concentrated across the entire asset inventory. Inspection resources and capital maintenance budgets can be directed to the locations that the data identifies as priorities — not distributed on schedule or on institutional memory about which sections have historically caused problems.
Geohazard Assessment and Environmental Monitoring
Landslide-prone terrain, volcanic areas, and coastal zones subject to erosion or sea-level-driven inundation all require monitoring over spatial scales that make ground-based instruments impractical as the primary monitoring system. InSAR — particularly SBAS in semi-vegetated terrain — provides the wide-area spatial context that allows geohazard managers to identify active movement zones, prioritise ground investigation, and establish early warning thresholds calibrated to observed displacement rates rather than assumed risk categories.
Agriculture in groundwater-dependent regions is increasingly affected by aquifer depletion-driven land subsidence. Central Valley in California, the North China Plain, the Iranian plateau — all are experiencing measurable and in some cases accelerating subsidence driven by unsustainable groundwater extraction. InSAR monitoring of agricultural subsidence zones provides the spatial data needed to identify the most severely affected areas, correlate surface deformation with groundwater level trends, and inform regulatory decisions about extraction limits.
The Sentinel-1 Archive: Ten Years of Ground Movement Already Recorded
One of the least understood but most commercially significant aspects of InSAR monitoring is the existence of the Sentinel-1 archive. The European Space Agency’s Sentinel-1 constellation has been acquiring SAR imagery globally since April 2014 — which means that for most permanent structures and terrain areas on Earth, a continuous deformation record already exists covering the past decade, whether or not anyone has been paying attention to it.
The practical implication of this is transformative. When a client engages SkyIntelGroup for InSAR monitoring today, the analysis does not start from today. It starts from 2014. An asset that has been experiencing progressive foundation settlement since 2019 — five years before any monitoring contract existed — will show that in the archive data. A tailings dam that began showing anomalous displacement on its downstream face eighteen months ago, before a concern was even raised internally, will reveal that timeline in the Sentinel-1 time series.
For pre-acquisition due diligence, this historical depth changes the nature of what is knowable before a transaction closes. A decade of deformation data for an infrastructure asset or a land parcel is not a theoretical dataset — it is an engineering record of what that ground has actually done under real loading conditions, seasonal groundwater variation, and whatever construction or extraction activity has occurred in the vicinity.
The archive also provides the context necessary to distinguish normal from anomalous behavior. A structure that has been settling at a consistent 2 mm per year for eight years and continues to do so is behaving differently from one where the settlement rate has doubled in the past six months. Both are moving. Only the historical record reveals which one has changed — and changed behavior is what carries engineering significance.
In July 2025, NASA and ISRO launched NISAR — the first satellite mission specifically designed to observe dynamic Earth processes globally at the scale and frequency that systematic monitoring requires. NISAR will add L-band and S-band SAR coverage to complement Sentinel-1’s C-band, improving performance in vegetated areas and enabling new multi-frequency analysis approaches. The archive will only grow deeper and the coverage more complete.
InSAR Limitations: What the Technology Cannot and Should Not Promise
Technical honesty about what InSAR cannot do is not a weakness in a commercial proposal — it is what distinguishes a provider with genuine expertise from one reading off a datasheet. InSAR is a powerful technique with real and well-understood constraints, and any client committing to a monitoring programme deserves to understand them.
Coherence in vegetated terrain
InSAR depends on the radar backscatter from the surface remaining stable between acquisitions. Dense vegetation — tropical forest, tall grass, agricultural crops — changes its geometric structure with wind, growth, and seasonal variation, causing the phase of the returned signal to become random and uninterpretable. In heavily forested areas, conventional InSAR produces little or no usable measurement. L-band SAR (longer wavelength) has better penetration through vegetation canopies than C-band Sentinel-1, and the NISAR mission will improve this significantly — but the constraint remains real and must be acknowledged in any monitoring design that includes forested terrain. Corner reflectors installed at specific points of interest can overcome this limitation for individual structures in otherwise incoherent areas.
Line-of-sight geometry
InSAR measures displacement in the satellite’s line of sight — the direction between the satellite and the ground surface, which is typically at an angle of 30–45 degrees from vertical. A purely horizontal movement perpendicular to the satellite’s flight direction produces almost no detectable signal. A purely vertical movement produces a strong signal. Most real ground deformation has components in multiple directions, and a full three-dimensional displacement vector requires combining data from at least two satellite geometries (ascending and descending passes). For most infrastructure monitoring applications — where subsidence dominates — the line-of-sight limitation is manageable. For scenarios where significant horizontal movement is expected (active landslides, fault-parallel motion), combining geometries or supplementing with ground-based measurements is necessary.
Processing expertise requirements
The gap between raw InSAR data and a reliable engineering deliverable is significant. Interferogram generation, phase unwrapping, atmospheric correction, persistent scatterer identification, time-series inversion — each step requires choices that affect the quality of the final product and that cannot be automated away without risking systematic errors in the output. Published studies have documented cases where poorly processed InSAR data has led to incorrect conclusions about ground stability. For engineering and regulatory applications where InSAR outputs inform safety decisions, the processing chain and quality control procedures matter as much as the data source. This is why we deliver interpreted products, not raw interferograms.
How SkyIntelGroup Delivers InSAR Intelligence Across Global Operations
The gap between InSAR as a research technique and InSAR as an operational monitoring tool is not primarily a technology gap — it is an interpretation and delivery gap. The satellite data exists. The processing methods are established. What most organisations lack is the combination of technical expertise to process it correctly and domain knowledge to translate the deformation outputs into answers that engineering, operations, and management teams can act on.
SkyIntelGroup bridges that gap. We process InSAR data using PS-InSAR and SBAS time-series methods, apply sector-specific interpretation expertise, and deliver outputs calibrated to the decisions our clients need to make — not generic deformation maps that require specialist interpretation to use.
For asset managers and portfolio owners, our deliverables include velocity maps showing mean annual displacement rates across the full analysis area, time-series charts for individual assets or measurement clusters, anomaly reports flagging deviations from baseline behavior, and comparative analysis of the historical archive against current acquisition data. All outputs are formatted for integration into existing GIS environments and engineering reporting workflows.
For project-specific applications — pre-construction baselines, construction monitoring, forensic post-event analysis — we scope the analysis to the spatial extent and time period relevant to the question, and deliver a technical report that engineering sign-off and legal proceedings can rely on.
We operate globally and deliver remotely. An asset in Australia, a mine in Chile, a pipeline corridor in Kazakhstan — the satellite data exists and the analysis can begin without a team on the ground. For the specific application of construction monitoring and ground subsidence analysis, our Construction services page covers the full range of what we offer across that sector.

Frequently Asked Questions About InSAR
What does InSAR stand for, and what does it actually measure?
InSAR stands for Interferometric Synthetic Aperture Radar. It measures the displacement of the Earth’s surface — specifically, movement in the direction between the satellite and the ground — by comparing the phase of radar signals returned from the same location at two different times. When the ground moves, even by a fraction of a millimetre, the distance between the satellite and that point changes, and that change is encoded in the phase difference between the two acquisitions. Processing multiple such comparisons over time produces a deformation time series: a record of how much every measured point has moved, and when.
What is the difference between InSAR and DInSAR?
DInSAR — Differential InSAR — is a specific application of the broader InSAR technique. Standard InSAR produces an interferogram comparing two SAR images. DInSAR adds a step: it removes the topographic contribution to the phase signal using an external digital elevation model, isolating the deformation component from the terrain shape component. In practice, DInSAR now refers broadly to two-pass interferometry — using a pair of images to measure displacement over a specific time interval. This is distinct from time-series techniques like PS-InSAR and SBAS, which process long stacks of images to extract millimetre-scale deformation trends over months and years.
How accurate is InSAR for measuring ground movement?
The measurement precision of PS-InSAR — the time-series technique used for infrastructure monitoring — is typically one to three millimetres per year under good conditions, with higher precision achievable using commercial high-resolution SAR data. This precision has been validated in numerous published studies comparing InSAR measurements against independent ground truth: GPS receivers, precise levelling surveys, total station measurements on bridges, buildings, and dams. The precision is sufficient to detect the differential movement rates that are structurally and operationally significant across all the sectors where InSAR is applied commercially.
What satellites are used for InSAR monitoring?
The Sentinel-1 constellation — operated by the European Space Agency as part of the Copernicus programme — is the primary source for most commercial InSAR applications. It provides free, globally available C-band SAR imagery with a 6-day repeat cycle over most land areas, and its archive extends to 2014. For applications requiring higher spatial resolution or more frequent revisits, commercial SAR satellites including TerraSAR-X, COSMO-SkyMed, and ICEYE provide additional capability at a data cost. The NISAR mission, launched in July 2025, will add L-band and S-band coverage that significantly improves performance in vegetated terrain.
Can InSAR work through clouds and at night?
Yes, on both counts. This is one of InSAR’s most operationally significant advantages over optical remote sensing. SAR satellites emit their own microwave pulses rather than depending on reflected sunlight, so they operate equally in complete darkness. Microwave radiation at the frequencies used by Sentinel-1 and other SAR missions passes through clouds, rain, and smoke without meaningful attenuation. The implication for monitoring applications in tropical, monsoon-affected, or high-latitude environments — where cloud cover can persist for months — is that InSAR maintains continuous data acquisition while optical monitoring is completely interrupted.
How far back does InSAR historical data go?
For most global land areas, the Sentinel-1 archive provides continuous SAR coverage from April 2014 onward — approximately eleven years as of 2026. For areas with historical coverage from earlier missions, data may extend further: ERS-1 and ERS-2 operated from 1991 to 2011, and Envisat from 2002 to 2012, providing potential archive depth of over three decades in well-covered areas. In practice, the Sentinel-1 archive is the primary source for most operational monitoring applications, providing more than sufficient historical depth to characterise long-term deformation trends and detect behavioral changes.
What industries use InSAR monitoring services professionally?
The primary commercial sectors using InSAR monitoring professionally are construction and civil engineering (foundation settlement, construction-induced movement, infrastructure deformation), mining (slope stability, tailings dam monitoring, surface subsidence), oil and gas (field subsidence, offshore platform movement, pipeline corridor monitoring), transport and utilities (railway and road network monitoring, water utility ground movement), insurance (subsidence risk assessment, property movement history for claims), and environmental and geohazard management (landslide monitoring, volcanic deformation, coastal erosion). The common thread is that all these sectors require knowledge of ground and structural movement at a scale and frequency that physical sensor networks cannot economically provide across their full asset inventories.
The Ground Has Always Been Moving. InSAR Is What Makes That Visible.
The subsidence that damaged a road embankment, the settlement that cracked a building facade, the slope movement that became a pit wall failure — none of these begin on the day they become visible. They begin weeks, months, or years earlier as millimetre-scale displacements that accumulate below the threshold of any inspection, any visual assessment, any monitoring system that was not specifically designed to detect them.
InSAR — and specifically the long time-series methods that extract deformation from the Sentinel-1 archive — makes that pre-visible movement measurable. Not retrospectively, as forensic evidence after something has gone wrong, but continuously, as operational intelligence that gives engineers, asset managers, and operators the lead time to respond before consequences materialise.
The Sentinel-1 archive means that for most assets and terrain areas of interest, the data already exists. The question is not whether the information is available — it is whether the analysis has been done. For organisations managing infrastructure, mineral assets, energy production facilities, or environmental liabilities where ground movement carries financial or safety consequences, that is a question worth answering before a problem makes it unavoidable.