Structural Health Monitoring for Infrastructure That Sensors Will Never Reach
Fewer than one in five bridges worldwide has a structural health monitoring system installed. That figure is not a criticism of infrastructure managers — it is a consequence of how the conventional monitoring model works. Installing sensors on a structure is not a matter of attaching a device and switching it on. It is a full engineering project: defining what parameters to measure, selecting instruments, designing data acquisition networks, managing access to restricted or difficult points on the structure, calibrating, commissioning, and maintaining a system that needs to keep working through weather, traffic loads, and years of service. The economics of that process make comprehensive coverage of a large infrastructure portfolio impossible under any realistic budget.
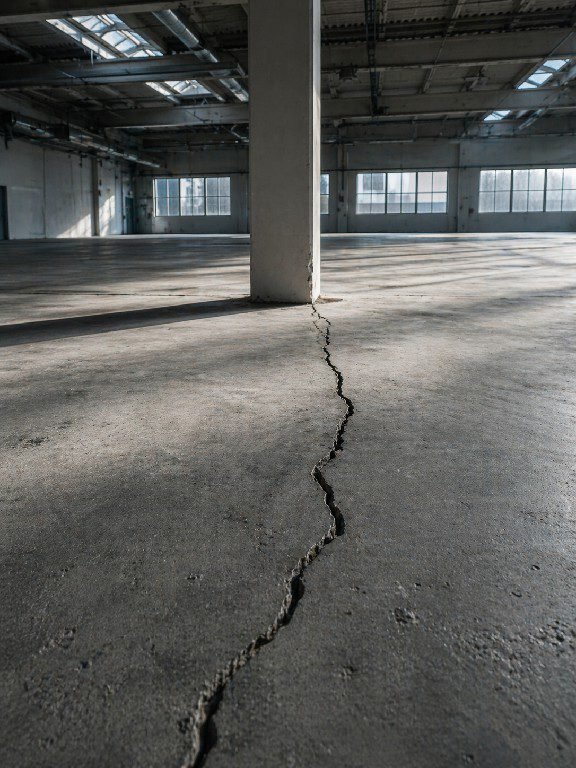
The structures that get monitored are the ones that have already raised concern — a visible crack, a known geology problem, a high-traffic corridor where an interruption would be politically unacceptable. Everything else is managed on periodic visual inspection cycles. And visual inspection, however well executed, has a fundamental limitation: it detects problems that have already become visible. The deterioration that precedes visible damage — the millimetres of differential movement accumulating over months or years before a crack appears in the deck or a pier begins to lean — is invisible to any inspection that is not actively measuring it.
SkyIntelGroup works with infrastructure owners, asset managers, and construction engineers to address that coverage gap using satellite-based deformation monitoring. No sensors to install. No access to the asset required. And a data archive that already covers most of the world’s permanent structures going back to 2014 — regardless of whether anyone has been reading it.
What Structural Health Monitoring Actually Measures — and Where It Stops
Structural health monitoring, in its conventional form, is the practice of using permanently or semi-permanently installed instrumentation to track the condition and performance of a specific structure over time. The range of parameters it measures is broad and the technology is mature — the challenge has never been what sensors can measure, but where they can realistically be deployed.
Strain gauges measure how structural members deform under load. They detect fatigue accumulation in steel, stress concentrations at connections, and changes in load distribution that indicate developing damage. Accelerometers capture the vibration signature of a structure — its natural frequencies and mode shapes — which act as a fingerprint of its current stiffness. When damage develops, stiffness changes, and the fingerprint changes with it. Inclinometers track tilt and rotation at specific points — foundation elements, retaining wall sections, bridge piers — detecting the early stages of differential movement before it becomes structurally significant. Piezometers measure groundwater pressure in the soil beneath and around a structure, which is critical for understanding the forces acting on foundations and embankments. Settlement sensors detect vertical displacement at defined points, tracking whether a structure is descending and at what rate.
Each of these instruments is highly capable within its defined measurement zone. The limitation is not precision — modern SHM sensors are exceptionally accurate. The limitation is spatial. A strain gauge measures the member it is bonded to. An inclinometer measures the point where it is installed. The terrain surrounding a bridge pier, the embankment sections between monitoring points, the adjacent structures affected by the same groundwater changes — none of these appear in a sensor-based SHM dataset unless a sensor happens to be installed there too. And in practice, it almost never is.
This spatial constraint is what makes structural integrity monitoring at portfolio scale fundamentally different from monitoring at asset scale. A single well-instrumented bridge can tell you a great deal about that bridge. It tells you nothing about the forty-nine others under the same department’s responsibility.
| Sensor Type | What It Measures | Best Application | Coverage Limitation |
|---|---|---|---|
| Strain Gauge | Deformation under load in structural members | Bridges, beams, steel connections | Point measurement only — damage developing outside the instrumented zone is invisible |
| Accelerometer | Vibration signature and modal frequency changes | Long-span bridges, towers, tall buildings | Requires an undamaged baseline — no data before installation date |
| Inclinometer | Tilt and rotation in foundations and walls | Retaining walls, bridge piers, excavations | Fixed installation — no data on terrain or structures outside the sensor array |
| Piezometer | Groundwater pressure in foundation soil | Dams, embankments, deep excavations | Subsurface measurement only — no surface deformation data |
| Settlement Sensor | Vertical displacement at specific foundation points | Buildings, bridge piers, embankments | Sparse spatial coverage — differential movement between sensors goes undetected |
| Satellite InSAR | Millimetre-scale surface deformation across full structural footprint and terrain | Any permanent structure — individual assets, portfolios, regional networks | Does not measure internal stress, vibration, or subsurface pressure — complements sensors, does not replace them |
The Scale Problem No Sensor Network Can Solve
Installing a structural health monitoring system on a bridge is not a purchasing decision — it is an engineering project. The process begins with a structural assessment to determine which parameters matter most for that specific asset, which requires understanding its design, its load history, its geology, and its known vulnerabilities. From that assessment comes a sensor specification: which instruments, how many, where exactly on the structure, and with what redundancy. Then comes the access problem. The underside of a bridge deck, the faces of piers below waterline, the interior of bearing assemblies — these are not places you reach without planning. Traffic management, specialised access equipment, potentially temporary closure of lanes or the structure itself — all of that is before a single sensor has been installed.
Once installed, the system needs power, communication, data storage, and regular maintenance. A sensor that fails silently produces a gap in the record that may only be discovered months later. The data it produces needs to be interpreted by someone with the expertise to distinguish genuine structural anomalies from temperature effects, traffic loading patterns, and sensor drift. All of this has a cost — not a one-time cost, but a recurring annual cost that the asset owner must budget for in perpetuity.
The figures vary significantly by market, structure type, and monitoring scope, but reference ranges are consistent across published studies and industry data. A basic SHM deployment on a medium-span bridge typically costs between $50,000 and $250,000 in installation, with annual operating costs of $15,000 to $50,000 depending on system complexity and data analysis requirements. A comprehensive monitoring system for a major bridge or dam can exceed $1 million in capital cost. Those figures are not unreasonable for an asset worth tens or hundreds of millions of dollars — the problem is that most infrastructure portfolios contain dozens or hundreds of assets, and the monitoring budget for the whole portfolio rarely approaches the cost of instrumenting a single structure properly.
The result is a selection process that infrastructure managers navigate implicitly every year: which structures get monitored? In practice, the answer follows a consistent logic. The newest assets get monitored because they have the highest replacement value and the owners want to protect their investment. The assets with known problems get monitored because the risk is visible and the regulatory or political pressure is immediate. The highest-traffic corridors get monitored because an unplanned closure there would have economic and political consequences. Everything else — which in most regional networks represents between 70% and 90% of the total asset count — is managed on periodic visual inspection.
Visual inspection, however competently performed, cannot detect what it cannot see. The Ponte Morandi in Genova collapsed in 2018 after years of known concerns and periodic inspections that did not detect the state of the stay cable corrosion. The Fern Hollow Bridge in Pittsburgh collapsed in January 2022 following a 2021 inspection that rated it in poor condition — the inspection identified the problem category but could not provide the continuous deformation data that would have indicated how fast it was progressing. The pattern across structural failure investigations is consistent: the deterioration that causes failure precedes visible manifestation by months or years. During that period, without continuous measurement data, the asset management system is operating on the assumption that nothing significant is changing between inspection visits. That assumption is what fails.
The scale problem cannot be solved by improving sensor technology or reducing sensor costs. Even if sensor costs fell by 80%, the access, installation, maintenance, and data interpretation costs would still make comprehensive portfolio coverage prohibitively expensive for most public infrastructure managers. The solution requires a different approach to the question entirely — not how to instrument more structures, but how to know which structures need instrumentation.
Infrastructure Monitoring Solutions That Work Across an Entire Portfolio
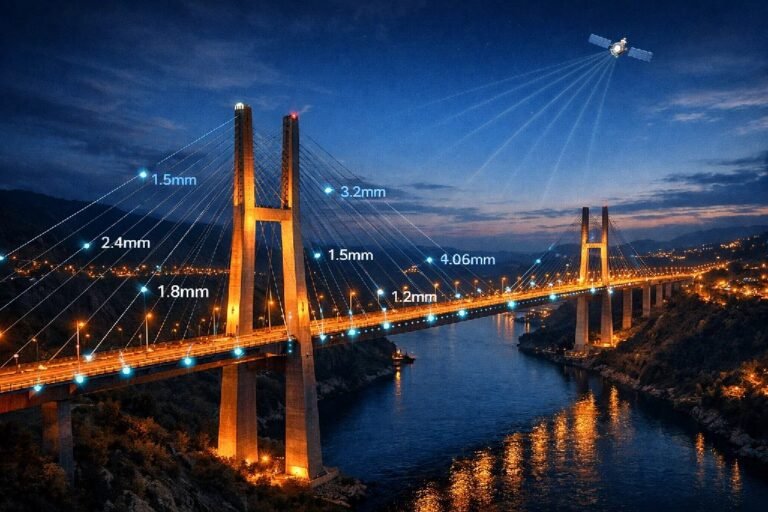
The Sentinel-1 constellation has been acquiring radar imagery of the Earth’s surface on a regular cycle since 2014. Every six days, a synthetic aperture radar pulse sweeps the same ground track and records the phase and amplitude of the signal reflected back from the surface. A bridge pier, a retaining wall face, a building facade, a dam crest — all of these present consistent radar reflectors that appear in every image in the archive. By comparing the phase of the signal between images acquired at different dates, it is possible to measure how far the surface has moved between those dates with a precision of one to three millimetres.
This is the fundamental principle behind InSAR — Interferometric Synthetic Aperture Radar — and it is not new technology. What has changed is the combination of free, globally available Sentinel-1 data, improved processing algorithms, and a growing body of published engineering research validating InSAR measurements against conventional ground-based surveys on real infrastructure. The technique has been applied to bridges in Italy, UK, USA, and across Europe. It has been used to monitor dam deformation in South America and the Middle East. It has been validated against total stations, GNSS receivers, and precise levelling surveys on structures ranging from highway overpasses to historic masonry viaducts. The results consistently demonstrate that satellite deformation measurements for civil infrastructure are reliable, reproducible, and actionable.
What this means for infrastructure monitoring solutions at portfolio scale is a fundamentally different operational sequence. The conventional approach starts with a deployment decision: which structure gets sensors, and which parameters. The satellite approach starts with a coverage question: across the entire portfolio, which structures are moving, at what rate, and has that rate changed recently? The analysis draws on the full archive — not from the date a contract is signed, but from 2014 onward. A structure that began showing differential settlement three years ago will show that in the data, whether or not anyone was looking at the time.
The practical output is a prioritisation layer. Instead of allocating inspection and sensor deployment resources on schedule or on instinct, the asset manager receives a deformation map of the entire portfolio showing which structures are stable within expected parameters, which are showing movement trends that warrant closer attention, and which have active and potentially accelerating deformation that requires immediate structural engineering input. That ranking does not replace the engineering judgement — it informs it, with data that has never previously existed for most of these assets.
For a detailed explanation of the satellite technology and its applications in civil construction monitoring, see our guide to subsidence monitoring.
Bridge Monitoring Systems and Beyond: Where Satellite Data Delivers the Most Value

The bridge monitoring system is the most documented application of satellite InSAR in civil infrastructure, and the published research base is substantial. Studies covering highway bridges in Italy, viaducts across the UK, and crossing structures in Spain and the US have all demonstrated that InSAR can detect thermally induced seasonal deformation cycles, traffic load deflection signatures, and — most importantly — progressive structural movement that deviates from expected behavior. A 2025 study published in Nature Communications found that spaceborne monitoring could provide coverage for over 60% of global bridge stock using existing Sentinel-1 data, and that incorporating this data into routine risk assessments could reduce the number of bridges classified as high-risk by approximately one third. These are not theoretical projections — they are calculations based on actual radar data coverage of real bridge inventories.
But the application of satellite civil infrastructure monitoring extends beyond bridges, and in some sectors the case is equally or more compelling.
Road and rail embankments are among the least monitored elements of transport networks despite being among the most vulnerable. An embankment failure does not give much warning — the visible signs of instability are often subtle until the slope reaches critical state. Satellite time series across the full length of a corridor identifies sections that have been moving differentially for months before any surface indicator appears, allowing targeted geotechnical investigation of the sections that actually need it rather than blanket inspection of the entire route.
Tunnels present a specific challenge for direct measurement — the structure is underground and largely inaccessible without traffic disruption. What InSAR measures is the surface expression of underground movement: subsidence of the ground above the tunnel lining, settlement of buildings and infrastructure passing over the tunnel alignment, differential displacement patterns that indicate changes in the stress state of the surrounding ground. For urban metro tunnels and road tunnels in developed areas, the surface above is densely covered with radar-reflective structures, making the measurement quality excellent.
Retaining walls along road and rail corridors are high-consequence structures that rarely receive systematic monitoring. A section of retaining wall that begins moving differentially — one end descending faster than the other, or the face beginning to tilt — will show that in satellite displacement data months before it becomes visually apparent. Detecting it at that stage means a maintenance intervention rather than an emergency closure and reconstruction.
Dams and reservoirs are subject to mandatory monitoring requirements in most jurisdictions, but the regulatory frameworks were written around ground-based instruments. Satellite monitoring provides a complementary data layer with complete spatial coverage of the dam crest, faces, abutments, and the surrounding terrain — including areas where sensor access is difficult or where the consequences of undetected movement in an uninstrumented zone could be severe.
Urban buildings in subsidence zones are in some ways the most commercially significant application. Coastal cities, clay-soil urban districts, and areas with histories of groundwater extraction have entire building stocks that are moving collectively — affected by the same underlying ground movement — but without any monitoring that would reveal which buildings are most affected and at what rate. The satellite data exists. The buildings are all in it. Whether that data is being used to inform property management, insurance underwriting, or infrastructure planning is a decision that has nothing to do with the technology.
How SkyIntelGroup Monitors Structural Integrity Without Setting Foot on the Asset
The output of satellite-based structural health monitoring is not a raw dataset. It is a deformation time series — a graph of how much each measured point on a structure has moved, in what direction, at what rate, and how that rate has evolved over time. For every point in the analysis, there is a measurement for every satellite pass since 2014, giving a temporal resolution that no periodic inspection programme can match and a spatial density — tens of thousands of measurement points per square kilometre in urban areas — that no ground-based sensor network can approach at comparable cost.
What SkyIntelGroup delivers from that data depends on what the client needs answered.
For Asset Managers Responsible for Multiple Structures
The primary value is portfolio-wide prioritisation. Without deformation data covering the full asset inventory, maintenance and inspection resources are distributed on schedule, on visible condition, or on institutional knowledge about which structures have previously caused concern. All three of those allocation methods share the same weakness: they tell you about the structures you already know about, not about the ones quietly developing problems that nobody has noticed yet.
With satellite analysis covering the entire portfolio simultaneously, the allocation question changes. Instead of asking which structures are scheduled for inspection this year, the question becomes which structures are showing movement that justifies bringing that inspection forward — and which stable structures can safely remain on a longer cycle without increasing risk. That reallocation does not just improve risk management. It frees up inspection and maintenance budget that was previously being spent on structures that the data confirms are not the priority.
The historical archive matters here as much as the current data. A structure that has been stable for nine years and has begun showing accelerating displacement in the past six months is a very different risk profile from one that has been moving at a consistent rate throughout the archive period. Understanding that trajectory — not just the current state — is what allows an engineering response that is proportionate to the actual risk rather than the visible condition.
For Engineers Before and During Construction
Construction activity changes the stress state of soil over areas that extend well beyond the immediate footprint of the works. Excavation for a building foundation, tunnelling for a metro extension, deep piling, dewatering operations — all of these alter groundwater levels, remove lateral soil support, and introduce vibration that can destabilise structures located significant distances from the construction boundary. In dense urban environments, the zone of influence of a major excavation can extend to dozens of structures that the construction team has no direct responsibility for monitoring but that adjacent property owners and transport authorities need to track.
Satellite monitoring provides the pre-construction baseline that makes this possible. If the archive shows that a building or bridge 200 metres from a proposed excavation has been completely stable for ten years, and that stability changes after groundworks begin, the data documents the relationship between the construction activity and the induced movement. That documentation is not just technically useful — it is legally significant in jurisdictions where construction-induced damage to adjacent property creates liability.
Post-construction, the same data confirms whether the structures affected by the works have stabilised at their new position or continue to move — a distinction that matters for sign-off, warranty periods, and long-term asset management.
For Owners Assessing an Asset Before Acquisition or Repair
A structural survey conducted at the time of a property or infrastructure acquisition documents what the asset looks like on that specific day. It cannot document whether the structure has been progressively deforming for the past five years, at what rate movement is occurring, or whether movement has recently accelerated. Those questions are answerable with satellite archive data — and they are directly relevant to the financial decision being made.
An infrastructure asset showing no visible structural problems but a consistent 4mm per year of differential settlement over the Sentinel-1 archive period is a different investment proposition from one that is genuinely stable. The same applies to a building acquisition in a known subsidence zone, a dam purchased as part of a renewable energy portfolio, or a road network being transferred between government entities. The deformation history exists in the satellite data. Accessing it before completing the acquisition is a straightforward risk management decision.
Our full range of Construction services covers foundation settlement analysis, subsidence monitoring, construction progress tracking, and infrastructure stability assessment alongside satellite-based structural monitoring.

Frequently Asked Questions About Structural Health Monitoring
What is structural health monitoring and why does it matter for aging infrastructure?
Structural health monitoring is the practice of using instrumentation and data analysis to track the condition and performance of an engineering structure over time, with the goal of detecting changes before they progress to structural failure or unplanned closure. Its relevance to aging infrastructure is not abstract — it is a direct response to the trajectory of global infrastructure stock. The majority of bridges, tunnels, dams, and built infrastructure in developed economies was constructed in the post-war period between 1945 and 1980. Design lifespans for these structures were typically set at 50 to 75 years, meaning a substantial proportion of the world’s critical infrastructure is now operating beyond or at the outer limit of its original design life. The deterioration processes at work — fatigue in steel, carbonation and chloride ingress in concrete, scour at bridge foundations, creep in masonry — are gradual, cumulative, and largely invisible until they reach an advanced stage. SHM provides the continuous measurement data that allows asset owners to understand what is actually happening in their structures, rather than managing on assumptions and periodic snapshots.
How does satellite-based structural integrity monitoring differ from sensor-based systems?
Sensor-based SHM measures specific physical parameters — strain, vibration, tilt, groundwater pressure — at the points where instruments are physically installed, typically at high frequency and in near real time. It is the appropriate solution for structures where real-time dynamic monitoring of load response and material behavior is required. Satellite-based structural integrity monitoring using InSAR measures surface deformation — the millimetre-scale movement of the visible parts of a structure and its surrounding terrain — across the full footprint of any asset in the satellite’s field of view, using radar images acquired every few days. The key differences are coverage, installation requirement, and historical depth. A sensor system covers the points where sensors exist; satellite monitoring covers every reflective surface in the analysis area. A sensor system starts collecting data from installation day; satellite data goes back to 2014. A sensor system requires physical access to the asset; satellite monitoring requires none. The two approaches answer different questions and are most powerful when used together: satellite data identifies where deformation is occurring and at what rate across an entire portfolio, and sensor systems provide the detailed continuous data for the specific structures where that level of monitoring is warranted.
Can InSAR replace traditional structural health monitoring sensors?
No, and it is important to be clear about this. InSAR does not measure the parameters that sensors measure. It cannot capture the vibration signature of a bridge deck under a passing train, the stress in a specific steel member under fatigue loading, the acoustic emission from a developing crack, or the groundwater pressure in the soil beneath a foundation. For structures where continuous dynamic monitoring is required — a major crossing under seismic risk, a dam with a downstream population — a full sensor-based SHM system remains the correct and necessary solution. What satellite monitoring changes is not the need for sensors on critical individual structures, but the process by which the rest of a portfolio is managed. The structures that have never had sensors because the economics made comprehensive deployment impossible are not currently being monitored in any meaningful sense. Satellite data gives those structures a monitoring baseline — not as precise as a sensor array, but infinitely better than nothing. And by identifying which of those previously unmonitored structures are actually showing deformation, it makes sensor deployment decisions rational rather than arbitrary.
What types of infrastructure can be monitored with satellite data?
Any permanent structure that presents a consistent radar-reflective surface across multiple satellite passes can be measured with InSAR. In practice, this includes bridges and viaducts, road and rail embankments, retaining walls, tunnels (via the surface expression of underground movement), dams and reservoirs, buildings of all types, offshore platforms, port and harbour structures, and pipeline corridors. The technique works equally at the scale of a single structure and at the scale of a regional network of hundreds of assets. The practical constraints on measurement quality are surface coherence — heavily vegetated or frequently flooded surfaces return lower-quality measurements — and structure size, where very small structures or narrow elements may have limited persistent scatterer density. For most permanent civil infrastructure in urban and semi-urban environments, measurement quality is sufficient for engineering-grade interpretation.
How far back does the satellite data archive go for civil infrastructure monitoring?
The Sentinel-1 constellation has been acquiring SAR imagery globally since 2014, providing approximately ten years of deformation history for virtually any structure in the world that falls within the satellite’s acquisition coverage. For structures in areas covered by earlier ESA missions — ERS-1 and ERS-2, which operated from the early 1990s through 2011, and Envisat, which operated until 2012 — archive data extending back over thirty years may be available depending on acquisition history and coherence. In most cases, the Sentinel-1 archive provides more than sufficient historical depth: ten years of deformation time series allows reliable identification of long-term trends, seasonal cycles from thermal expansion and groundwater variation, and deviations from established baseline behavior that indicate developing structural issues. The critical point is that this archive already exists — it does not need to be created from the date of engagement. An infrastructure asset that has been experiencing progressive foundation settlement since 2019 will show that in the data today, regardless of whether any monitoring program was in place at the time.
Is structure monitoring with satellites accurate enough for engineering decisions?
The precision of InSAR measurements — typically one to three millimetres per measurement point under good conditions, with higher precision achievable using advanced processing techniques and commercial high-resolution SAR data — is sufficient to detect the differential movements that are structurally significant in civil infrastructure. Published validation studies comparing InSAR measurements against conventional levelling surveys, GNSS receivers, and total stations on bridges, tunnels, and buildings consistently demonstrate agreement within the stated precision bounds. The outputs are used in structural assessments, forensic investigations following infrastructure incidents, insurance damage quantification, and regulatory compliance documentation in multiple countries. The important qualification is that InSAR measurements represent line-of-sight displacement — the component of movement in the direction between the satellite and the surface — and that correct interpretation requires understanding the satellite geometry and the likely direction of real structural movement. This is where engineering expertise in processing and interpreting the data is as important as the measurement precision itself.
What is the difference between a structural health monitoring system and continuous deformation monitoring?
A structural health monitoring system, in the conventional engineering sense, is an integrated platform — sensors, data acquisition hardware, communication infrastructure, and analysis software — designed to provide continuous or high-frequency data on a specific structure’s dynamic and quasi-static behavior. It is permanently or semi-permanently installed and operates as an ongoing part of the structure’s asset management. Continuous deformation monitoring using satellite InSAR is a service delivered on a regular update cycle — typically weekly, fortnightly, or monthly depending on satellite revisit frequency and monitoring requirements — that provides deformation measurements without any hardware on the asset. The distinction matters practically because the satellite service can be initiated without a site visit, scaled across any number of assets simultaneously, extended to cover surrounding terrain and adjacent structures, and initiated retroactively using the existing archive. It does not replace the SHM system for structures where real-time dynamic monitoring is the requirement — but it addresses the monitoring question for the far larger number of structures where no SHM system exists and none is likely to be installed.
The 80% of Infrastructure Nobody Is Watching
The structural health monitoring market is growing consistently — from approximately $2 billion today toward a projected $5 billion by 2035. More sensors are being deployed, more structures are being instrumented, and more infrastructure owners are moving from reactive to predictive maintenance models. All of that represents genuine progress. And yet the fundamental arithmetic of the coverage problem is not changing at the same pace. The growth in sensor deployment is concentrated in the same categories of assets that have always attracted monitoring investment — the newest, the highest-profile, the ones where visible risk has already been identified. The 80% of infrastructure that has never had continuous monitoring is not meaningfully closer to being monitored than it was a decade ago.
What has changed in that decade is the availability and accessibility of satellite data. The Sentinel-1 archive now extends back ten years. Processing costs have fallen as algorithms have improved and computing infrastructure has scaled. The body of published research validating InSAR for civil infrastructure applications has grown from a niche academic interest to a substantial engineering literature. The gap between what the technology can do and what the infrastructure management sector is actually using it for has never been wider — and that gap is where the opportunity sits.
The civil infrastructure monitoring approach that SkyIntelGroup delivers does not require that asset owners abandon their existing inspection programmes or their sensor-based SHM investments. It requires only that they add a data layer that currently does not exist for most of their portfolio — a continuous record of how each structure is actually moving, going back a decade, available now without a site visit. For some structures, that data will confirm that the inspection schedule is appropriate and nothing needs to change. For others, it will reveal movement that nobody knew was happening and that changes the maintenance decision entirely.
The question is not whether that information would be useful. The question is whether it is being accessed.