Remote Sensing for Urban Planning: Applications, Methods & Case Studies (2026)
The global remote sensing market is projected to surge from $22.87 billion in 2025 to $84.28 billion by 2035, representing a compound annual growth rate of 14%. Within this explosive growth, urban remote sensing has emerged as one of the fastest-expanding segments, driven by a simple reality: by 2050, approximately 70% of the world’s population will live in cities, creating unprecedented pressure on infrastructure, resources, and environmental systems.
Traditional urban planning methods—ground surveys, periodic censuses, manual inspections—simply cannot scale to meet the demands of modern metropolitan areas. A single city planner cannot physically inspect thousands of buildings for structural integrity, monitor sprawl across hundreds of square kilometers, or track vegetation health in real time. This is precisely where the application of remote sensing in urban planning becomes transformative, enabling municipalities to monitor entire cities with millimeter-precision from orbit.
This article explores the core technologies powering remote sensing for urban planning, examines proven applications with quantified results, and presents case studies from Istanbul to Shenzhen demonstrating measurable outcomes. Whether you are a city planner evaluating satellite solutions, an engineer assessing infrastructure stability, or a consultant advising municipal clients, you will find actionable insights grounded in peer-reviewed research from 2024 and 2025.
Core Technologies Powering Urban Remote Sensing
The foundation of remote sensing in urban planning rests on four complementary technologies, each capturing different aspects of the urban environment. Understanding their capabilities and limitations is essential for selecting the right approach for specific planning challenges.
Multispectral Satellite Imagery: The Foundation of Urban Monitoring
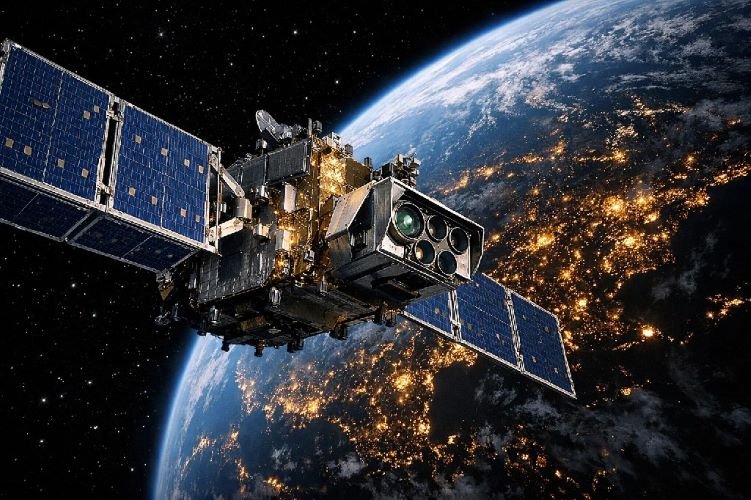
Multispectral satellites form the backbone of most satellite imagery urban planning applications. Platforms like Sentinel-2 and Landsat-8/9 capture reflected sunlight across multiple wavelength bands, revealing information invisible to the human eye.
Sentinel-2, operated by the European Space Agency, delivers 13 spectral bands at 10-meter resolution with a revisit time of just 5 days. This combination of spatial detail, spectral richness, and temporal frequency makes it ideal for tracking land use classification satellite applications. The visible bands (red, green, blue) show surface materials and built structures, while near-infrared bands reveal vegetation health through indices like NDVI (Normalized Difference Vegetation Index).
Recent advances in deep learning have dramatically improved classification accuracy. A 2025 study published in Scientific Reports demonstrated that an ensemble network called IRUNet, combining InceptionResNetV2 with UNet architecture, achieved 98.21% accuracy in land use classification using multi-year Sentinel-2 imagery. However, this benchmark performance comes with an important caveat: a systematic review of 89 peer-reviewed studies found that while controlled datasets routinely achieve accuracies above 98%, operational systems deployed at regional or global scales typically reach only 75-85% due to spatial autocorrelation and domain transfer limitations.
Synthetic Aperture Radar and InSAR: All-Weather Infrastructure Monitoring
Unlike optical sensors that depend on sunlight, Synthetic Aperture Radar (SAR) generates its own microwave pulses that penetrate clouds and operate day or night. This all-weather capability makes SAR indispensable for continuous urban growth monitoring in regions with frequent cloud cover.
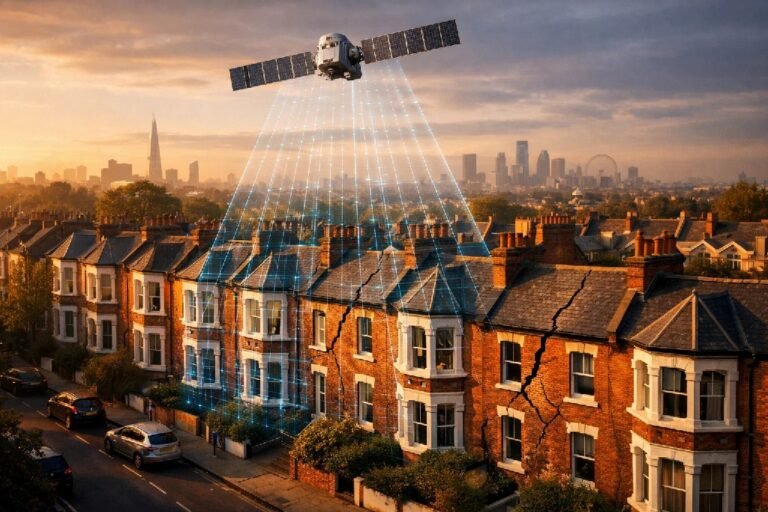
The real power of SAR emerges through Interferometric SAR (InSAR), which compares the phase differences between radar images acquired at different times to detect ground displacement with millimeter precision. InSAR urban infrastructure monitoring identifies «persistent scatterers» (PS points)—stable radar reflectors typically found on buildings, concrete pavements, bridges, and exposed rock formations.
A landmark study published in Nature Communications in October 2025 analyzed 744 long-span bridges globally and found that while fewer than 20% have structural health monitoring systems installed, Sentinel-1 InSAR could provide monitoring coverage for over 60% of these structures. This finding has profound implications for infrastructure management, suggesting that satellite-based monitoring could dramatically expand oversight of critical assets at a fraction of traditional sensor costs.
In urban subsidence monitoring, PS-InSAR has documented settlement rates exceeding 25 mm per year in cities built over depleted aquifers. The technique excels at tracking slow-moving phenomena—settlement from groundwater extraction, consolidation of reclaimed land, or thermal expansion of bridge structures—that would be invisible to periodic ground inspections.
LiDAR and 3D City Modeling
Light Detection and Ranging (LiDAR) technology provides the third dimension that optical and radar imagery cannot fully capture. Airborne LiDAR systems emit laser pulses and measure their return time to generate precise three-dimensional point clouds with vertical accuracy of 10-15 centimeters.
For urban planners, LiDAR enables extraction of building heights, modeling of urban canyons for wind flow analysis, and precise volume calculations for construction planning. The technology can map approximately 81 square kilometers per day, providing comprehensive terrain data for highway alignment, utility corridor design, and flood modeling.
Digital twin applications increasingly combine LiDAR-derived 3D models with satellite imagery and IoT sensor data to create virtual replicas of cities. These digital twins allow planners to simulate scenarios—testing the impact of a new development on traffic flow or evaluating flood risk under different climate projections—before implementing changes in the physical environment.
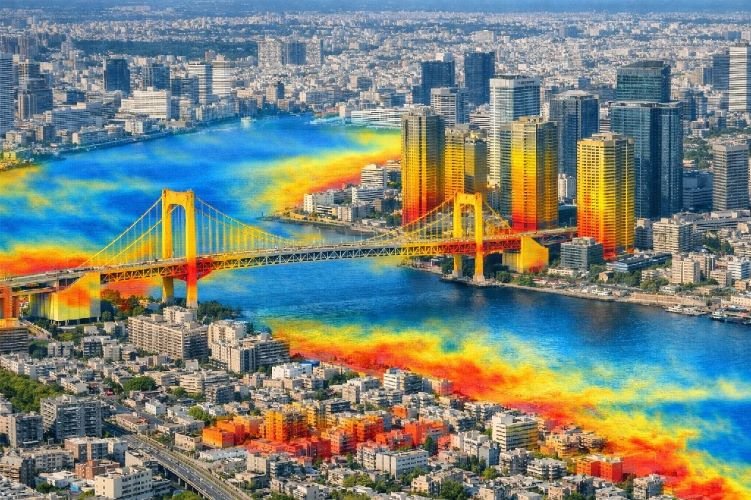
Thermal Imaging: Mapping Urban Heat Islands
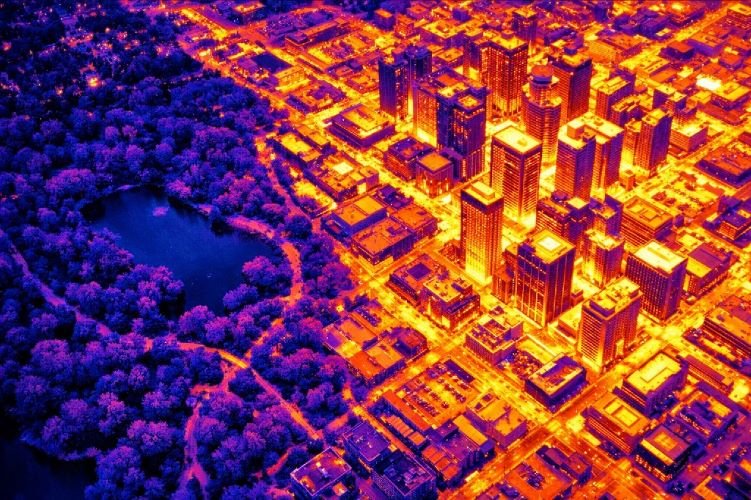
Thermal infrared sensors measure surface temperature rather than reflected light, revealing the urban heat island (UHI) effect where cities experience temperatures 5-10°C higher than surrounding rural areas. Landsat-8/9 provides thermal bands at 100-meter resolution (resampled to 30m), while NASA’s ECOSTRESS mission offers enhanced thermal imaging for vegetation stress and urban heat studies.
Urban heat island remote sensing identifies temperature hotspots where dark pavement, lack of vegetation, and waste heat from buildings create dangerous conditions during heat waves. A 2025 study using a U-Net convolutional neural network demonstrated that high-resolution thermal maps at 2-meter resolution could be generated from standard RGB imagery, democratizing access to detailed urban heat analysis that previously required expensive thermal sensors.
The practical applications extend beyond mapping. Thermal imagery guides placement of cooling infrastructure—parks, green roofs, reflective pavements—by quantifying temperature differentials between different surface types and land covers. Cities like Barcelona and Singapore have used thermal mapping to prioritize greening interventions in the hottest neighborhoods, directly linking satellite data to public health outcomes.
Key Applications of Remote Sensing in Urban Planning
The technologies described above enable a range of practical applications that are transforming how cities plan, monitor, and manage urban environments. Each application addresses specific planning challenges with quantifiable benefits.
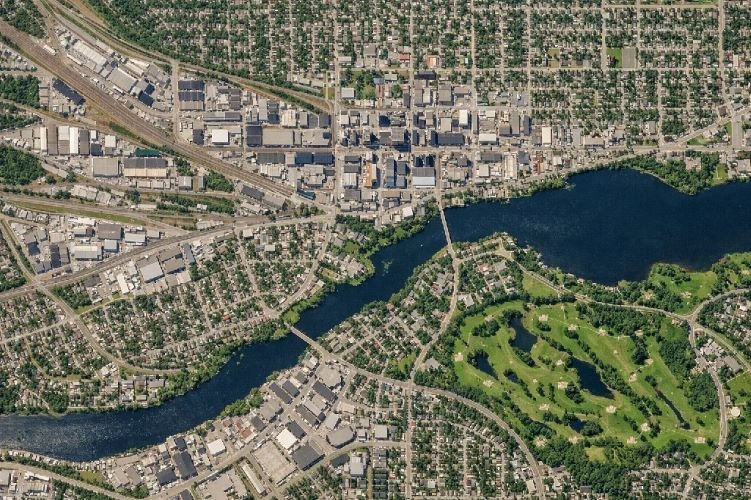
Land Use and Land Cover Classification
LULC classification represents the most mature application of remote sensing applications in urban planning. By categorizing every pixel in a satellite image as residential, commercial, industrial, green space, water, or bare soil, planners gain an objective inventory of how land is actually being used—often revealing significant differences from outdated zoning maps.
Machine learning algorithms have revolutionized classification accuracy. Traditional approaches using Random Forest or Support Vector Machines achieve 85-90% accuracy, while deep learning architectures like U-Net and convolutional neural networks push accuracy above 95% in controlled settings. Google Earth Engine has democratized access to these capabilities, allowing municipalities without specialized computing infrastructure to process petabytes of satellite data through cloud-based platforms.
The gap between benchmark and operational performance deserves attention. A systematic review analyzing studies from 2020-2025 found that geographic and temporal transferability reduces accuracy by 15-25 percentage points when models trained in one region are applied to another. This underscores the importance of local calibration and ground-truth validation for any GIS remote sensing urban planning project.
Urban Sprawl Monitoring and Growth Prediction
Time-series analysis of satellite imagery reveals urban expansion patterns that would be impossible to detect through periodic ground surveys. The Landsat archive, extending back to 1972, provides over five decades of consistent observations for tracking urban growth monitoring at 30-meter resolution.
Recent research demonstrates the power of this long-term perspective. The Dynamic World dataset, combining Sentinel-2 imagery with machine learning labels from 2016-2024, documented that built-up areas in the United States grew from 2.25% to 3.12% of total land cover—a seemingly small percentage that represents massive absolute expansion of urban footprints. This 10-meter resolution dataset enables tracking of annual and even seasonal land cover transitions with unprecedented detail.
In rapidly urbanizing regions, satellite monitoring serves as an early warning system. Machine learning models trained on historical imagery can predict where growth will occur based on proximity to existing development, infrastructure availability, and terrain characteristics. These predictive capabilities support long-range infrastructure planning and help municipalities anticipate service demands before development arrives.
Infrastructure Deformation Monitoring with InSAR
Beyond regional monitoring, InSAR urban infrastructure analysis provides building-specific and structure-specific deformation measurements. The technique identifies persistent scatterers on man-made structures—corners of buildings, bridge decks, concrete surfaces—and tracks their displacement over time with millimeter precision.
Research in Mokpo, South Korea, a coastal city built extensively on reclaimed land, revealed the practical implications of this capability. InSAR analysis documented that areas reclaimed decades ago continue experiencing consolidation-driven settlement, with rates ranging from -2.34 to -5.64 mm per year and cumulative displacements reaching -83 mm. Road and railway infrastructure crossing these zones face ongoing stress that would be undetectable without continuous satellite monitoring.
The thermal expansion of bridges presents another application. Studies have successfully distinguished normal seasonal thermal cycling from anomalous deformation that may indicate structural problems. When a bridge deck expands more at the top than the bottom, or when one section settles while adjacent sections remain stable, InSAR data provides the evidence needed to prioritize inspection and maintenance resources.
Urban Green Space Analysis
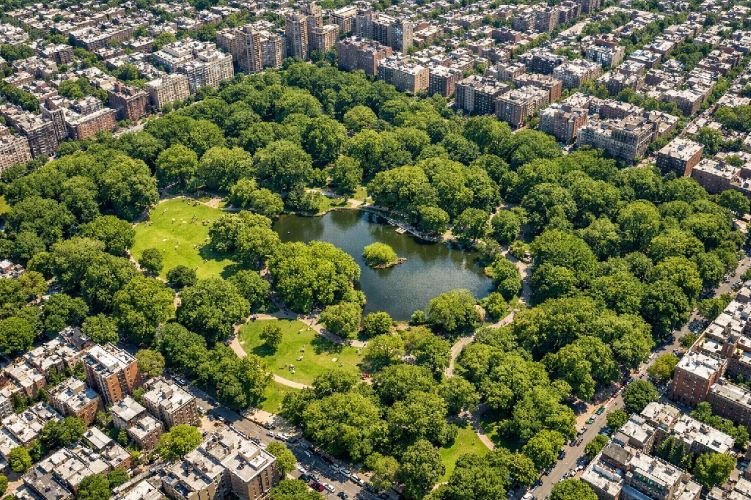
Vegetation monitoring through NDVI (Normalized Difference Vegetation Index) quantifies the distribution and health of urban green spaces. The index exploits the fact that healthy vegetation strongly reflects near-infrared light while absorbing red light, creating a distinctive spectral signature detectable from orbit.
Sentinel-2 imagery at 10-meter resolution enables monitoring of parks, street trees, private gardens, and even green roofs. Research comparing NDVI with ground-based surveys found strong correlations between satellite-derived greenness and actual canopy cover, though the index tends to underestimate three-dimensional vegetation characteristics like tree height and canopy volume.
The connection between urban greenery and temperature is well-documented. Studies consistently find that areas with greater than 70% vegetation cover are significantly cooler than adjacent built-up zones. This relationship guides urban forestry programs that use satellite data to identify neighborhoods most in need of tree planting and to track the success of greening initiatives over time.
Flood Risk Assessment and Disaster Response
SAR imagery provides unique capabilities for flood monitoring because microwave signals penetrate cloud cover and detect water surfaces through their distinctive radar backscatter. During active flooding events, SAR satellites can map inundation extent within hours, supporting emergency response and evacuation planning.
Digital elevation models derived from satellite data identify low-lying areas vulnerable to flooding before disasters occur. When combined with hydrological models and climate projections, this topographic information enables risk-based land use planning that steers development away from flood-prone zones or requires appropriate mitigation measures.
Post-disaster damage assessment demonstrates another application. Following the 2023 Turkey earthquake, researchers used InSAR to rapidly assess building damage across affected municipalities, demonstrating that satellite data can complement visual inspections when ground access is limited or dangerous. This capability accelerates damage documentation for insurance claims, recovery planning, and reconstruction prioritization.
Satellite Platforms for Urban Planning
Case Studies: Remote Sensing Transforming Urban Planning
Theory and technology specifications only tell part of the story. The following case studies demonstrate quantified results from real-world implementations of remote sensing in urban planning across different geographic and developmental contexts.
Istanbul, Turkey: 30-Year Urban Growth and Environmental Impact Analysis
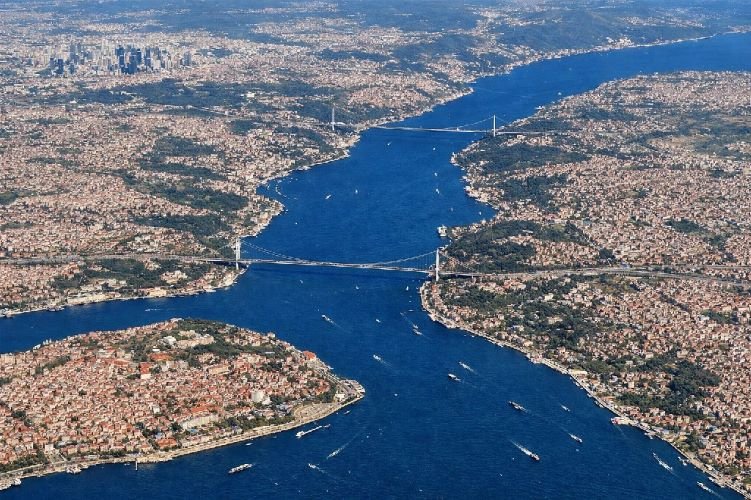
A comprehensive 2025 study investigated urbanization impacts in Başakşehir, Istanbul, analyzing critical environmental indicators including Land Surface Temperature, NDVI, and Urban Heat Island indices over three decades. The research employed a hybrid machine learning approach combining Convolutional Neural Networks with Random Forest classification.
The methodology achieved 93.33% accuracy in land use classification, demonstrating that advanced AI techniques can reliably categorize complex urban landscapes. More importantly, the study quantified the relationship between urban expansion and environmental degradation: statistically significant correlations emerged between green area loss, water content reduction, and temperature increases.
The findings reinforced a critical insight for urban planners: strategic protection of vegetation and implementation of blue-green infrastructure can measurably reduce urban heat island effects. The 30-year perspective enabled researchers to evaluate which historical planning decisions created current thermal hotspots—information directly applicable to avoiding similar outcomes in future development zones.
Shenzhen, China: Subsidence Monitoring in Reclaimed Coastal Land
Shenzhen’s Qianhai Bay exemplifies the challenges facing cities built on reclaimed land. Between 1999 and 2016, extensive land reclamation projects expanded the buildable area, but this artificial land carries inherent geotechnical risks that persist decades after construction.
InSAR analysis using both SBAS and PS-InSAR techniques revealed significant subsidence in the land reclamation areas. Three metro lines—Lines 1, 5, and 11—traverse zones showing active settlement signals. The research documented that areas with the most recent reclamation lack sufficient persistent scatterer targets, requiring SBAS techniques that work with distributed scatterers of moderate coherence.
The practical implication is clear: coastal cities with land reclamation require continuous InSAR monitoring not just during construction, but for decades afterward. Settlement from consolidation of artificial fill and underlying marine sediments continues long after surface infrastructure appears stable, creating ongoing risks for transportation systems and buildings.
United States: Tracking Urbanization with Dynamic World Dataset
The Dynamic World dataset represents a new paradigm in continental-scale land cover monitoring. Combining Sentinel-2 imagery with machine learning labels across eight consecutive years (2016-2024), the dataset provides 10-meter resolution land cover classification for the entire United States.
Analysis revealed that built-up areas expanded from approximately 2.25% to 3.12% of total land cover—a change of nearly one percentage point that reflects population growth, economic activity, and policy decisions driving urban development. While this percentage appears modest, it represents substantial absolute expansion with significant implications for ecosystems, agriculture, and resource planning.
The dataset’s consistent methodology across years enables reliable change detection that distinguishes actual land cover transitions from artifacts of different classification approaches. This consistency supports evaluation of growth management policies and provides baseline data for tracking progress toward sustainability goals.
Challenges and Limitations
Honest assessment of limitations is essential for realistic project planning. The application of remote sensing in urban planning faces several technical and practical constraints that practitioners must navigate.
The gap between benchmark accuracy and operational performance represents a significant challenge. Models achieving 98% accuracy on standardized datasets often drop to 75-85% when deployed across different geographic regions or time periods. This degradation stems from spatial autocorrelation that inflates reported accuracies and from limited transferability of models trained in one urban context to another.
Resolution limitations constrain certain applications. Sentinel-2 at 10-meter resolution cannot distinguish individual buildings in densely built areas, and mixed pixels containing multiple land cover types complicate classification. Very high resolution imagery from commercial providers addresses this limitation but at significant cost—$20-40 per square kilometer for tasked acquisitions.
Cloud cover renders optical imagery unusable for many regions during substantial portions of the year. SAR overcomes this limitation but provides different information than optical sensors, lacking the spectral bands needed for vegetation health assessment or detailed land cover classification.
Finally, remote sensing detects physical land cover rather than human activities. Distinguishing a residential building from a commercial office requires either very high resolution imagery showing building use indicators or integration with administrative data sources. The technology reveals what exists on the ground, but determining how spaces are actually used often requires complementary data.
Future Trends: AI, Digital Twins, and Real-Time Monitoring
The trajectory of urban remote sensing points toward increasingly automated, real-time, and integrated systems. Several emerging trends will reshape capabilities within the next five years.
Nanosatellite constellations are democratizing high-frequency monitoring. Planet Labs already provides daily global coverage at 3-meter resolution, and new entrants continue expanding capacity. The cost of satellite data continues declining while revisit frequency improves, making near-real-time monitoring economically viable for applications beyond emergency response.
Artificial intelligence is automating analysis that previously required expert interpretation. Self-supervised learning approaches like masked autoencoders achieve 85-90% of fully supervised performance while requiring 90% fewer labeled training samples. Edge computing enables processing aboard satellites or drones, delivering analyzed results rather than raw data and dramatically reducing bandwidth requirements.
Digital twins represent the integration frontier. Virtual city models combining satellite imagery, LiDAR, IoT sensor streams, and administrative databases create comprehensive platforms for scenario planning and operational optimization. Planners can test proposed developments, evaluate policy changes, and optimize city services within the digital environment before implementing changes in the physical world.
The convergence of 5G networks, IoT sensors, and satellite monitoring creates possibilities for truly smart cities where infrastructure responds dynamically to real-time conditions. Traffic signals adjust to actual flow patterns visible from orbit, irrigation systems respond to vegetation stress detected via NDVI, and emergency services route around obstructions identified in near-real-time satellite imagery.
How Satellite Intelligence Supports Your Urban Planning Projects
The technologies and applications described throughout this article are not theoretical possibilities—they represent proven capabilities available today for municipal governments, engineering firms, and urban development consultancies seeking data-driven approaches to planning challenges.
SkyIntelGroup delivers comprehensive satellite intelligence services specifically designed for urban planning and smart city development:
Urban Planning & City Expansion Analysis provides land use classification, growth pattern monitoring, and scenario modeling using multispectral satellite imagery and machine learning. Track urban sprawl, identify development pressure zones, and support evidence-based zoning decisions.
Infrastructure Deformation Monitoring with InSAR delivers millimeter-precision displacement measurements for bridges, buildings, metro systems, and underground infrastructure. Detect settlement, subsidence, and structural movement before visible damage occurs.
Environmental Monitoring combines thermal imaging for urban heat island mapping with NDVI analysis for vegetation health assessment. Support climate adaptation planning and green infrastructure initiatives with quantified baseline data.
Geospatial Analysis Services integrate satellite-derived products with municipal GIS systems, enabling seamless workflow integration for planning departments already working with geographic data platforms.
Frequently Asked Questions
What is remote sensing in urban planning?
Remote sensing in urban planning refers to the use of satellite and aerial imagery to collect data about urban areas without physical contact. This includes multispectral imagery for land use classification, SAR/InSAR for infrastructure monitoring, thermal imaging for heat island mapping, and LiDAR for 3D city modeling. The technology enables planners to monitor large areas continuously, track changes over time, and make data-driven decisions about zoning, infrastructure investment, and environmental management.
Which satellite is best for urban land use mapping?
For most urban land use mapping applications, Sentinel-2 offers the optimal balance of resolution (10 meters), revisit frequency (5 days), spectral bands (13), and cost (free). For projects requiring higher detail, Planet provides 3-meter daily imagery at commercial rates, while WorldView-3 delivers 30-centimeter resolution for building-level analysis at premium pricing. The choice depends on project scale, budget, and required level of detail.
How accurate is satellite-based land use classification?
Benchmark studies using deep learning achieve accuracies of 95-98% on standardized datasets. However, operational accuracy in real-world deployments typically ranges from 75-85% due to geographic transferability limitations and spatial autocorrelation effects. Local calibration with ground-truth data significantly improves results for specific project areas.
Can satellites detect building subsidence?
Yes. InSAR (Interferometric Synthetic Aperture Radar) technology detects ground displacement with millimeter precision by comparing radar images acquired at different times. The technique identifies persistent scatterer points on buildings, bridges, and infrastructure, tracking their vertical and horizontal movement over time. Studies have documented subsidence rates exceeding 25 mm/year and cumulative displacements reaching 80+ mm in cities built on reclaimed land or over depleted aquifers.
What is the cost of satellite imagery for urban planning?
Costs vary dramatically by resolution and acquisition type. Sentinel-2 and Landsat imagery are completely free through government data portals. Commercial providers like Planet offer annual subscriptions starting around $9,650 for defined areas of interest. Very high resolution tasked imagery from WorldView or Pléiades costs $20-40 per square kilometer, with minimum order requirements. Processing and analysis services add additional costs depending on project complexity.
How often can satellites monitor the same urban area?
Revisit frequency depends on the satellite constellation. Sentinel-2 provides imagery every 5 days at the equator (more frequently at higher latitudes). Sentinel-1 SAR revisits every 6-12 days. Planet’s constellation achieves daily global coverage at 3-meter resolution. For emergency response or rapid change detection, commercial providers can task satellites for specific acquisition within 24-48 hours under clear sky conditions.
Conclusion
The application of remote sensing in urban planning has evolved from experimental technology to essential infrastructure for forward-thinking municipalities and planning organizations. With the global market projected to reach $84.28 billion by 2035 and urban populations approaching 70% of humanity by 2050, satellite-based planning tools are no longer optional—they are fundamental to managing the complexity of modern cities.
The evidence is clear: LULC classification achieves operational accuracies of 75-85% across diverse urban environments; InSAR monitors infrastructure deformation with millimeter precision where fewer than 20% of critical structures have traditional sensors; thermal imaging quantifies urban heat islands to guide climate adaptation; and NDVI analysis tracks vegetation health to support green infrastructure planning.
From Istanbul’s 30-year growth analysis to Shenzhen’s coastal subsidence monitoring to continental-scale tracking across the United States, the case studies demonstrate that remote sensing urban planning delivers measurable, actionable intelligence for cities facing unprecedented challenges.
The question is no longer whether to adopt satellite-based planning tools, but how quickly your organization can integrate these capabilities into existing workflows. The technology is mature, the data is increasingly accessible, and the competitive advantage goes to those who act decisively.