Wildfire Risk Assessment for Insurers: How Satellite Intelligence Enables Accurate Property-Level Underwriting
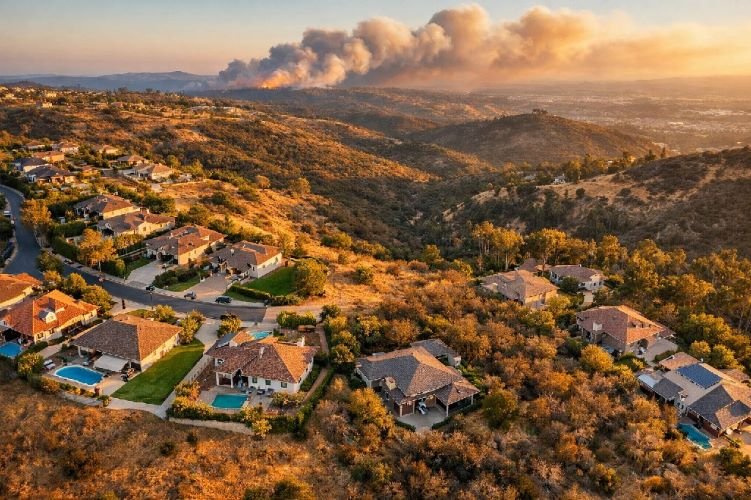
The January 2025 Los Angeles wildfires delivered a brutal lesson to the global insurance industry. With insured losses reaching $40 billion from the Palisades and Eaton fires alone, these events became the costliest wildfire catastrophe in recorded history. Yet the most troubling revelation was not the scale of destruction but rather the complete failure of traditional wildfire risk assessment methodologies to predict which properties would survive and which would be reduced to ash.
Across California, 1.2 million homes valued at approximately $940 billion remained classified as «low risk» or «no risk» under federal wildfire assessments, even as satellite-based property-level wildfire scoring systems had flagged elevated danger at these exact locations months before ignition. This disconnect between outdated regional models and modern fire risk modeling capabilities represents both a crisis and an opportunity for insurers willing to embrace satellite intelligence.
For insurance carriers, reinsurers, and underwriting teams operating in wildfire-prone markets worldwide, the path forward requires abandoning census-level generalizations in favor of granular, property-specific landscape risk assessment powered by earth observation technology. This transformation is not merely about better data; it is about fundamentally reimagining how wildfire underwriting decisions are made in an era of accelerating climate volatility.
The $40 Billion Wake-Up Call: Why Traditional Wildfire Risk Models Are Failing Insurers Worldwide
The catastrophic losses from the 2025 Los Angeles fires did not emerge from nowhere. Swiss Re documented that global insured losses from natural catastrophes reached $107 billion in 2025, with the United States accounting for 83% of that total. Wildfire specifically has transformed from a seasonal nuisance into a year-round, multi-billion-dollar peril that traditional actuarial approaches simply cannot adequately price.
The fundamental problem lies in how fire hazard assessment has historically been conducted. Legacy models relied primarily on historical burn patterns, broad geographic zones, and infrequent updates that failed to capture the dynamic nature of wildfire risk. When the California FAIR Plan, the state’s insurer of last resort, grew from covering 210,000 homes in 2020 to more than 463,000 by 2024 with total exposure exceeding $450 billion, it became clear that private insurers were fleeing markets they could no longer accurately assess.
From Historical Data to Forward-Looking Satellite Intelligence
Traditional wildfire risk assessment operated on a fundamentally flawed premise: that past fire behavior reliably predicts future risk. This backward-looking approach ignored critical variables that change continuously, including vegetation growth patterns, drought conditions, property modifications, and the expansion of human development into the wildland-urban interface.
Satellite-based fire risk modeling inverts this paradigm entirely. Rather than extrapolating from decades-old burn records, modern earth observation platforms capture current conditions with remarkable precision. Vegetation stress becomes visible weeks before ignition through spectral analysis. Fuel load analysis quantifies exactly how much combustible material surrounds each structure. Defensible space compliance can be verified remotely without expensive on-site inspections.
The data speaks definitively: properties assessed using property-level wildfire scoring from satellite intelligence demonstrate 44 times greater predictive accuracy than traditional regional models. This is not incremental improvement but rather a categorical transformation in underwriting capability.
The Property-Level Gap in Wildfire Underwriting
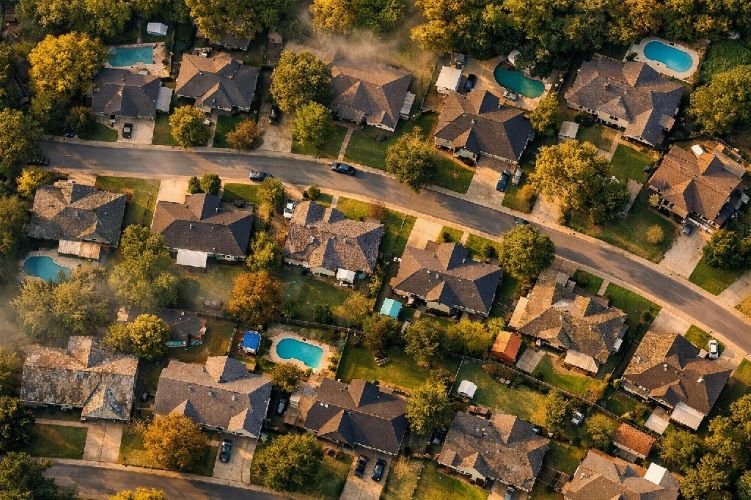
Perhaps the most damaging limitation of legacy approaches was their inability to differentiate risk at the individual property level. Two homes on the same street might face radically different wildfire exposure based on roof material, vegetation clearance, slope aspect, and proximity to continuous fuel blocks. Yet traditional fire hazard assessment assigned identical scores to both properties simply because they shared a ZIP code.
Analysis following the 2025 Los Angeles fires revealed that even within fire perimeters where 60% of structures were destroyed, property-level wildfire scoring correctly identified which homes were 50% more likely to burn based on structure-specific characteristics. This granularity matters enormously for wildfire underwriting decisions. Insurers applying property-level intelligence can expand coverage to lower-risk homes within generally hazardous areas while appropriately pricing or declining genuinely dangerous exposures.
The implications extend far beyond California. From the Mediterranean fire corridors of Spain and Portugal to the bushfire-prone landscapes of Australia, insurers worldwide face the same fundamental challenge: regional averages obscure the property-specific factors that actually determine loss outcomes.
How Satellite-Based Wildfire Risk Assessment Transforms Insurance Underwriting
The technical foundation of modern wildfire risk assessment rests on the systematic analysis of multiple data streams captured by earth observation satellites. Unlike aerial photography that provides static snapshots, satellite constellations deliver continuous monitoring across vast geographic areas, enabling the detection of risk indicators that would be invisible to ground-based inspections.
Understanding how these technologies function is essential for insurance professionals seeking to evaluate landscape risk assessment capabilities and integrate satellite intelligence into their underwriting workflows.
Vegetation Health Analysis and Fuel Load Mapping
The primary driver of wildfire behavior is fuel: the vegetation that feeds advancing flames. Fuel load analysis through satellite imagery quantifies both the type and condition of combustible material surrounding insured properties with remarkable precision.
Multispectral sensors capture reflected light across multiple wavelengths, including near-infrared bands that healthy vegetation strongly reflects. By calculating the Normalized Difference Vegetation Index (NDVI), analysts can map vegetation density and health across entire regions. Declining NDVI values over time indicate stressed, dying, or drought-affected vegetation that burns more readily and intensely.
Beyond simple density measurements, advanced vegetation risk mapping distinguishes between fuel types. Dense chaparral presents different ignition characteristics than eucalyptus groves or grasslands. Continuous fuel blocks that have not burned for decades accumulate combustible material that can generate catastrophic fire behavior, while recently treated areas present lower hazard profiles.
For insurers, this capability transforms wildfire underwriting from educated guesswork into data-driven decision-making. Rather than relying on regional fire history, underwriters can assess actual current conditions surrounding each property in their portfolio.
Defensible Space Analysis Without On-Site Inspections
Defensible space analysis represents one of the highest-value applications of satellite intelligence for insurance purposes. Maintaining adequate clearance between structures and surrounding vegetation is the single most effective measure property owners can take to reduce wildfire vulnerability, yet verifying compliance has historically required costly physical inspections.
High-resolution satellite and aerial imagery combined with computer vision algorithms now enable remote defensible space analysis at scale. Systems can measure the distance from structures to nearest vegetation, identify overhanging branches above rooflines, calculate fuel density within critical zones around buildings, and detect changes over time as vegetation regrows following clearing.
Research demonstrates that properties with heavy vegetation coverage within the critical Zone 0 area (0-10 feet from structures) experience 115% higher wildfire claim frequency and 272% higher loss ratios compared to properties maintaining proper clearance. This quantifiable relationship between defensible space analysis findings and actual loss outcomes provides actuarially sound justification for risk-based pricing differentials.
The economic implications for insurers are substantial. Automated vegetation risk mapping can assess thousands of properties in hours rather than the weeks required for manual inspection programs, dramatically reducing underwriting costs while improving accuracy.
Topographic Risk Factors and Fire Spread Modeling
Wildfire behavior depends heavily on terrain. Flames travel faster uphill as preheating accelerates ignition of vegetation above the fire front. Slope aspect determines solar exposure and therefore vegetation moisture content. Canyon configurations can channel winds and create chimney effects that produce explosive fire growth.
Satellite-derived digital elevation models enable sophisticated fire risk modeling that accounts for these topographic influences at property-specific resolution. Slope calculations, aspect analysis, and terrain roughness measurements feed into fire spread simulations that predict how flames would likely approach and impact individual structures under various wind and weather scenarios.
This physics-based approach to landscape risk assessment moves beyond simple probability scores to model actual fire behavior. Properties on ridgelines facing continuous fuel blocks in steep terrain face fundamentally different exposure than valley-floor homes surrounded by irrigated landscapes, even if both fall within the same regional hazard zone.
Critical Risk Indicators Satellites Detect Before Ignition
The most valuable aspect of satellite-based wildfire risk assessment may be its ability to identify danger before fires start. Post-disaster damage assessment helps with claims processing, but pre-ignition risk identification enables proactive underwriting decisions that prevent losses entirely.
Multiple observable indicators, when analyzed systematically through fire risk modeling frameworks, provide weeks or months of advance warning that conditions are deteriorating toward critical thresholds.
NDVI Vegetation Stress and Drought Indices
Vegetation stress manifests in spectral signatures long before visual symptoms become apparent to human observers. Declining NDVI values indicate reduced chlorophyll content as plants respond to water deficit, heat stress, or disease. This stressed vegetation contains less moisture, ignites more readily, and burns more intensely.
Analysis of conditions preceding the January 2025 Los Angeles fires revealed that NDVI values in affected areas dropped to critical levels months before ignition. In the Palisades fire area, NDVI declined to 0.3 by October 2024, indicating severe vegetation stress. Similar patterns appeared across Eaton and Hurst fire zones, with the percentage of healthy, dense vegetation plummeting throughout the second half of 2024.
The Evaporative Demand Drought Index (EDDI) provides complementary intelligence by measuring atmospheric demand for moisture. Rising EDDI values indicate intensifying drought conditions that progressively desiccate vegetation. When EDDI reaches extreme levels while NDVI shows declining vegetation health, the combination signals elevated ignition risk that should trigger portfolio review and underwriting caution.
For insurers implementing vegetation risk mapping programs, these indices provide objective, continuously updated risk signals that support dynamic portfolio management rather than static annual reviews.
Live Fuel Moisture and Land Surface Temperature
Live fuel moisture (LFM) content directly determines how readily vegetation will ignite and how intensely it will burn. When LFM drops below critical thresholds, typically around 60-80% depending on vegetation type, fire behavior transitions from manageable to extreme. Below 13.5% moisture content in dead fuels, ignition becomes nearly inevitable given any spark source.
Satellite-based thermal sensors measure land surface temperature (LST) patterns that correlate strongly with vegetation moisture status. Elevated LST indicates reduced evapotranspiration as plants close stomata to conserve water, simultaneously signaling moisture stress and creating conditions favorable for ignition.
The 2025 Los Angeles fires occurred after fuel moisture dropped below critical thresholds across the region during December 2024. This condition was observable through satellite monitoring and represented a clear signal that fire hazard assessment should reflect elevated risk. Insurers with access to this intelligence could have adjusted their exposure management strategies accordingly.
Structural Vulnerability and Property Characteristics
While environmental conditions determine whether fires start and spread, structural characteristics determine whether individual buildings survive. Property-level wildfire scoring must incorporate both landscape hazard and structural vulnerability to provide meaningful wildfire underwriting guidance.
Satellite and aerial imagery analysis can identify key structural risk factors without physical inspection. Roof material classification distinguishes fire-resistant Class A coverings from combustible wood shingles. Building footprint analysis reveals attached structures, wooden decks, and other features that facilitate flame spread. Vegetation encroachment detection identifies trees overhanging roofs or shrubs against exterior walls.
Properties demonstrating comprehensive ember resistance measures, including screened vents, enclosed eaves, and non-combustible perimeter materials, show dramatically better survival rates even within active fire zones. Satellite-based verification of these characteristics enables wildfire underwriting decisions that reward mitigation investment while appropriately pricing unprotected exposures.
Transform Your Wildfire Underwriting with Satellite Intelligence
SkyIntelGroup delivers property-level wildfire risk reports for insurers worldwide. No software integration required — just actionable intelligence for accurate pricing decisions.
Property-Level vs. Regional Wildfire Scoring: Why Granularity Matters
The distinction between property-level and regional wildfire risk assessment approaches represents perhaps the most consequential decision insurers face when modernizing their underwriting capabilities. Regional models provide administrative simplicity but sacrifice the accuracy necessary for sustainable pricing in volatile markets.
Understanding why granularity matters requires examining both the technical limitations of census-level approaches and the complex physics of how fires actually damage structures.
The Failure of Census-Level Fire Hazard Assessment
Federal wildfire assessments, including FEMA’s National Risk Index, operate at census-tract resolution. This means thousands of properties receive identical risk classifications regardless of their individual characteristics. The approach made sense when computational limitations prevented property-level analysis, but it produces increasingly untenable results as development expands into hazardous areas.
Analysis comparing federal census-level classifications against property-level wildfire scoring revealed staggering discrepancies. Across California, 1.2 million properties designated as «Very Low,» «Relatively Low,» or «No Rating» for wildfire risk under federal assessments showed elevated danger when evaluated at property level. These misclassified homes represented approximately $940 billion in residential property value, essentially invisible to insurers relying on regional fire hazard assessment data.
The January 2025 fires validated these concerns dramatically. More than 3,000 properties worth approximately $2.4 billion in areas impacted by the Palisades and Eaton fires showed elevated wildfire risk under property-level wildfire scoring despite federal low-risk classifications. Census-level models simply cannot capture the vegetation proximity, slope conditions, and structural characteristics that determine actual loss outcomes.
For insurers, reliance on regional landscape risk assessment creates systematic mispricing. Properties genuinely at low risk subsidize those at elevated risk within the same zone, driving adverse selection as better risks seek coverage elsewhere while hazardous exposures concentrate in portfolios.
Urban Conflagration and Structure-to-Structure Spread Modeling
The 2025 Los Angeles fires introduced a phenomenon that many traditional fire risk modeling approaches failed to anticipate: urban conflagration. Once flames reached sufficient intensity in dense neighborhoods, fire spread directly from structure to structure through radiant heat and ember transport, independent of wildland vegetation.
This structure-to-structure propagation fundamentally changes how wildfire risk assessment must evaluate urban and suburban properties. Traditional models focused exclusively on wildland-urban interface hazard miss the conflagration potential within built environments where building density, construction materials, and spacing determine outcomes.
Properties at the edge of neighborhoods adjacent to continuous fuel blocks play disproportionate roles in conflagration events. Well-hardened edge homes can interrupt ember-driven ignition and delay fire spread into interior areas, while unprotected edge properties often become initial ignition sources that trigger cascading losses throughout developments.
Advanced fire risk modeling now incorporates conflagration dynamics, analyzing building density patterns, structure spacing, construction types, and ember transport potential to assess community-level vulnerability beyond individual property characteristics. This represents the frontier of wildfire underwriting sophistication.
Key Satellite Indicators for Wildfire Risk Assessment
Integrating Satellite Intelligence into Insurance Workflows
The practical value of wildfire risk assessment technology depends entirely on how effectively it integrates into existing insurance operations. Raw satellite data means nothing to underwriters; actionable intelligence that supports specific decisions creates competitive advantage.
Modern fire risk modeling platforms must deliver insights at the moments that matter: initial policy quoting, renewal evaluation, and portfolio management. Understanding these integration points enables insurers to extract maximum value from landscape risk assessment investments.
Pre-Bind Risk Assessment and Accurate Pricing
The most immediate application of satellite-based wildfire underwriting occurs at initial policy quoting. When a submission arrives, underwriters need rapid access to property-specific risk intelligence without delays that frustrate agents and lose business.
Property-level wildfire scoring delivered through API integration or batch processing enables instant risk assessment at the point of quote. Rather than applying regional rating factors that inadequately differentiate individual exposures, underwriters can access specific findings: defensible space compliance status, vegetation density within critical zones, roof material classification, slope exposure, and proximity to continuous fuel blocks.
This granularity enables accurate pricing that appropriately charges for actual risk rather than broad geographic averages. Properties with excellent mitigation characteristics in generally hazardous areas become insurable at reasonable rates, while genuinely dangerous exposures receive appropriate pricing or declination. The result is healthier portfolios with better loss ratios and reduced adverse selection.
Portfolio Monitoring and Renewal Risk Management
Wildfire risk assessment should not be a one-time evaluation but rather an ongoing monitoring function. Conditions change: vegetation regrows, drought intensifies, properties deteriorate. Static risk classifications based on initial underwriting become obsolete as circumstances evolve.
Satellite-based vegetation risk mapping enables continuous portfolio surveillance. Automated systems can flag properties where NDVI indicates deteriorating vegetation health, where defensible space clearance has been compromised by regrowth, or where regional drought indices signal elevated seasonal risk. These alerts enable proactive renewal management: adjusting pricing, requiring mitigation, or non-renewing exposures that have become unacceptably hazardous.
Leading insurers now implement annual or even quarterly fuel load analysis updates across their wildfire-exposed portfolios. This dynamic approach prevents the surprise losses that occur when static risk classifications fail to reflect changed conditions.
Mitigation Verification for Premium Adjustments
Regulatory frameworks increasingly require insurers to provide premium discounts for properties demonstrating effective wildfire mitigation. California’s Safer from Wildfires regulations, for example, mandate recognition of defensible space maintenance, fire-resistant roofing, and other hardening measures in rate calculations.
Historically, verifying mitigation compliance required expensive on-site inspections that made discount programs administratively impractical for most properties. Satellite-based defensible space analysis changes this equation entirely. Remote verification of clearance zones, vegetation management, and visible hardening measures enables cost-effective compliance confirmation at scale.
This capability creates virtuous cycles: insurers can profitably offer meaningful discounts for mitigation, property owners receive financial incentives to reduce risk, and portfolio loss ratios improve as protected properties survive events that destroy unmitigated exposures. Fire risk modeling that incorporates mitigation credits appropriately prices the actual reduced hazard, enabling insurers to write coverage they would otherwise decline.
Global Wildfire Risk: Beyond California to Australia, Europe, and Latin America
While California dominates wildfire insurance discussions due to market size and catastrophic loss concentration, wildfire risk assessment challenges extend worldwide. Climate change is intensifying fire weather conditions across multiple continents simultaneously, creating global demand for sophisticated landscape risk assessment capabilities.
Insurers operating internationally require fire risk modeling solutions that function regardless of geographic location. The same satellite technologies that assess California chaparral apply equally to Portuguese eucalyptus forests, Australian bushland, and Chilean pine plantations.
Mediterranean Fire Corridors in Spain, Portugal, and Greece
Southern Europe experiences severe wildfire seasons with increasing frequency as summer heat waves intensify and drought conditions persist longer into autumn. Portugal lost more than 100 lives to wildfires in 2017, while Greece suffered devastating fires in 2018 and 2021 that destroyed entire communities.
The Mediterranean region presents distinct wildfire underwriting challenges. Mixed wildland-urban interface development patterns, historic construction using combustible materials, narrow roads limiting evacuation and firefighting access, and vegetation types adapted to fire all contribute to elevated risk profiles.
Satellite-based vegetation risk mapping provides essential intelligence for insurers writing coverage in these markets. NDVI monitoring detects seasonal vegetation stress patterns. Fuel load analysis quantifies combustible material accumulation. Defensible space analysis verifies property-level mitigation compliance against local regulations that increasingly mandate clearance zones.
Wildfire Exposure in Australia, Chile, and Canada
Australia’s 2019-2020 Black Summer bushfires burned more than 18 million hectares and destroyed nearly 6,000 buildings, demonstrating catastrophic loss potential that rivals or exceeds California events. Chile’s 2023 fires killed more than 130 people, and Canada’s 2023 season burned 17.2 million hectares, a national record.
Each of these markets presents unique fire hazard assessment requirements. Australian eucalyptus forests generate extreme ember transport conditions. Chilean plantation forestry concentrates fuel loads. Canadian boreal forests experience fire behavior patterns distinct from Mediterranean or chaparral ecosystems.
Despite these differences, satellite-based wildfire risk assessment methodologies apply universally. The same spectral indices that measure vegetation stress in California detect equivalent conditions in Victoria or Valparaíso. Property-level wildfire scoring approaches that analyze defensible space and structural vulnerability translate across jurisdictions with appropriate local calibration.
Why Global Insurers Need Location-Agnostic Risk Intelligence
Multinational insurers and reinsurers require fire risk modeling capabilities that function consistently across their entire geographic footprint. Fragmented approaches using different vendors and methodologies for each market create operational complexity, inconsistent risk assessment quality, and inability to compare exposures across regions.
Satellite-based landscape risk assessment offers inherent global scalability. The same sensor systems observe properties worldwide. Analytical methodologies developed for one market transfer to others with appropriate calibration. Centralized wildfire underwriting platforms can deliver consistent property-level intelligence regardless of whether the subject property sits in Malibu, Melbourne, or Madeira.
For insurers seeking efficient global operations, this consistency matters enormously. Portfolio managers can compare wildfire exposures across countries using compatible metrics. Underwriting guidelines can reference standardized risk classifications. Reinsurance discussions proceed from common analytical foundations.
From Satellite Capture to Underwriting Decision
Satellite Acquisition
Multispectral and radar imagery captured for target properties
Vegetation Analysis
NDVI, fuel load, and defensible space calculated
Terrain Modeling
Slope, aspect, and fire spread pathways assessed
Risk Scoring
Property-level scores generated with factor breakdown
Report Delivery
Actionable intelligence delivered to underwriting team
How SkyIntelGroup Delivers Wildfire Risk Intelligence for Insurers
SkyIntelGroup provides comprehensive wildfire risk assessment services designed specifically for insurance applications. Unlike software platforms that require technical integration and ongoing subscription commitments, SkyIntelGroup delivers ready-to-use intelligence reports that support immediate underwriting decisions.
The approach combines multiple earth observation data sources, including optical satellite imagery, synthetic aperture radar, and derived spectral indices, into unified property-level wildfire scoring outputs that require no specialized technical expertise to interpret.
Multi-Temporal Vegetation Monitoring and Change Detection
SkyIntelGroup’s vegetation risk mapping services leverage systematic satellite monitoring to track how conditions evolve over time. Rather than static snapshots that quickly become obsolete, multi-temporal analysis reveals trends: vegetation encroachment toward structures, defensible space deterioration, seasonal stress patterns, and long-term fuel accumulation.
This temporal dimension proves particularly valuable for portfolio management applications. Properties that maintained adequate clearance at policy inception may have experienced regrowth that now compromises protection. Seasonal drought patterns that elevate risk during renewal periods become visible through systematic monitoring rather than annual inspections.
For insurers managing substantial wildfire-exposed portfolios, SkyIntelGroup provides regular monitoring updates that flag properties requiring attention. This proactive approach enables intervention before losses occur rather than reactive claims processing afterward.
Custom Property-Level Risk Reports with Defensible Space Analysis
Each SkyIntelGroup wildfire underwriting report provides property-specific findings organized for immediate decision support. Reports include defensible space analysis findings with measured distances to vegetation, fuel load analysis quantifying combustible material density, topographic exposure assessment, and structural vulnerability observations.
Rather than abstract scores that obscure underlying factors, reports explain specifically what creates risk at each property. This transparency enables underwriters to make informed decisions and provides documentation supporting pricing rationale for regulatory inquiries or dispute resolution.
SkyIntelGroup calibrates reporting formats to client requirements. Some insurers prefer detailed narrative assessments for complex commercial risks. Others require streamlined data outputs for high-volume residential processing. The underlying analytical methodology remains consistent while delivery adapts to operational needs.
Flexible Delivery Without Software Integration
Many fire risk modeling vendors require substantial IT investment to integrate APIs, configure data feeds, and maintain technical infrastructure. This creates barriers for smaller insurers and delays implementation for larger organizations navigating procurement processes.
SkyIntelGroup operates differently. Property assessments can be requested through straightforward communication channels and delivered as standalone reports requiring no system integration. This flexibility enables immediate deployment without IT projects, budget allocations for software licenses, or organizational change management.
For insurers seeking to test property-level wildfire scoring value before committing to enterprise implementations, SkyIntelGroup provides an accessible entry point. Pilot programs can evaluate accuracy against actual loss experience, demonstrate underwriting utility, and build organizational confidence before broader deployment.
Wildfire Insurance Market: Critical Statistics
Ready to Implement Property-Level Wildfire Risk Assessment?
SkyIntelGroup serves insurers globally with satellite-based wildfire intelligence. From single property assessments to portfolio-wide monitoring, we deliver the data you need for accurate underwriting.
Frequently Asked Questions About Wildfire Risk Assessment
What is wildfire risk assessment and why do insurers need it?
Wildfire risk assessment is the systematic evaluation of factors that determine whether properties face elevated danger from wildfire events and how likely they are to sustain damage if fires occur. Insurers require this intelligence to price policies accurately, select risks appropriately, and manage portfolio exposure. Without robust fire risk modeling, insurers either overprice low-risk properties, driving adverse selection as good risks leave, or underprice hazardous exposures that generate unsustainable losses.
How does satellite-based wildfire risk assessment differ from traditional methods?
Traditional fire hazard assessment relied on historical burn records, regional classifications, and periodic on-site inspections. Satellite-based approaches provide continuous monitoring of actual current conditions, including vegetation health, fuel load analysis, defensible space analysis, and topographic exposure. This enables dynamic, property-specific intelligence rather than static regional averages. The accuracy improvement is substantial: property-level wildfire scoring from satellite data demonstrates 44 times greater predictive accuracy than conventional regional models.
What vegetation indices do satellites use for wildfire risk assessment?
Several spectral indices support vegetation risk mapping for insurance applications. NDVI (Normalized Difference Vegetation Index) measures vegetation health and density through chlorophyll reflectance patterns. The Evaporative Demand Drought Index (EDDI) indicates drought intensity affecting fuel moisture content. Land surface temperature measurements correlate with vegetation stress conditions. Together, these indicators provide early warning of deteriorating conditions that elevate ignition and fire behavior risk.
Can satellites really assess defensible space without physical inspections?
Yes. High-resolution satellite and aerial imagery combined with computer vision algorithms enable remote defensible space analysis at scale. Systems measure distances from structures to nearest vegetation, identify overhanging branches, calculate fuel density within critical zones, and detect changes over time. Research demonstrates that properties lacking adequate defensible space experience 115% higher claim frequency and 272% higher loss ratios, making this assessment capability highly valuable for wildfire underwriting decisions.
Does wildfire risk assessment work outside the United States?
Satellite-based landscape risk assessment functions globally. The same earth observation platforms and analytical methodologies that assess California properties apply equally to Mediterranean Europe, Australia, Chile, Canada, and other wildfire-prone regions. SkyIntelGroup specifically serves insurers worldwide, delivering property-level wildfire scoring regardless of geographic location. This global capability enables multinational insurers to apply consistent risk assessment approaches across their entire portfolio.
How quickly can insurers implement satellite-based wildfire risk assessment?
Implementation timelines vary depending on desired integration depth. SkyIntelGroup’s flexible delivery model enables immediate deployment without IT integration. Insurers can request property assessments and receive reports within days, enabling pilot programs that demonstrate value before broader commitment. More comprehensive implementations involving API integration and automated workflows typically require several months but deliver operational efficiencies for high-volume processing.
Get Property-Level Wildfire Risk Intelligence Today
SkyIntelGroup delivers satellite-based wildfire risk assessment for insurers worldwide. Accurate underwriting data without software integration.