Urban Heat Island in Dubai: How Satellite Thermal Mapping Is Exposing the City’s Hidden Heat Crisis
On July 17, 2024, Dubai’s «feel like» temperature reached 62°C. Not a forecast. Not a worst-case projection. A recorded figure that prompted official government warnings and advised both residents and tourists to avoid outdoor exposure entirely. For a city that markets itself as a global destination for business, luxury, and innovation, it was a stark reminder that beneath the glass towers and engineered coastlines, an urban heat crisis has been building for decades.
The urban heat island in Dubai is not a side effect of development — it is its most direct thermal consequence. A city that expanded its urban footprint at 17% per year between 1990 and 2017, replacing desert with concrete, asphalt, and glass at a pace that left vegetation growing at just 0.18% annually, has created one of the most extreme human-made thermal environments on Earth. Satellite data confirms what residents feel every summer: Dubai’s land surface temperatures now reach 51.8°C in urban zones, while the city sits 3.5°C to 4.5°C hotter than its surrounding desert during the day — and 3.3°C hotter at night, when cooling should be at its most effective.
At SkyIntelGroup, we use satellite thermal imaging to map, analyze, and monitor urban heat islands for cities and organizations worldwide. Dubai represents one of the most compelling and urgent applications of this technology — and as we explored in our broader analysis of the urban heat island effect, the path from awareness to action requires spatial precision that only satellites can deliver. Our Smart Cities services are designed exactly for this challenge.
Why the Urban Heat Island in Dubai Is in a Category of Its Own
Most cities dealing with urban heat island problems are amplifying temperatures that are already manageable. Dubai is different. It is a metropolis built on a subtropical desert where summer air temperatures already exceed 40°C before any urban amplification is factored in. The heat island effect here does not push a warm city into discomfort — it pushes a city already operating at the limits of human physiological tolerance into outright danger.
The numbers that define this situation are not projections or models. They come from satellite records and ground-based measurements accumulated over decades. Between 1990 and 2017, Dubai expanded its built-up area at an average annual rate of 17%, transforming sand into towers, highways, and artificial islands. In that same period, green areas grew at 0.18% per year — a ratio of nearly 100 to 1 between urban surface and vegetation. The consequence, measured by Landsat over a ten-year window, was a 64.8% change in land cover and a 1.5°C increase in land surface temperature — not from climate change alone, but from the thermal physics of replacing permeable, reflective desert with heat-absorbing infrastructure.
The result today: a city where the «feel like» temperature hit 62°C in July 2024, where the maximum land surface temperature recorded by satellite reached 51.8°C in 2022, and where June 2024 brought air temperatures of 46°C in the city and 49.4°C in suburban areas. May 2025 repeated that intensity, registering the hottest May ever recorded in Dubai’s history.
What Satellite Data Reveals About Dubai’s Thermal Landscape
The Landsat Record — 22 Years of Urban Heat Growth Mapped from Space
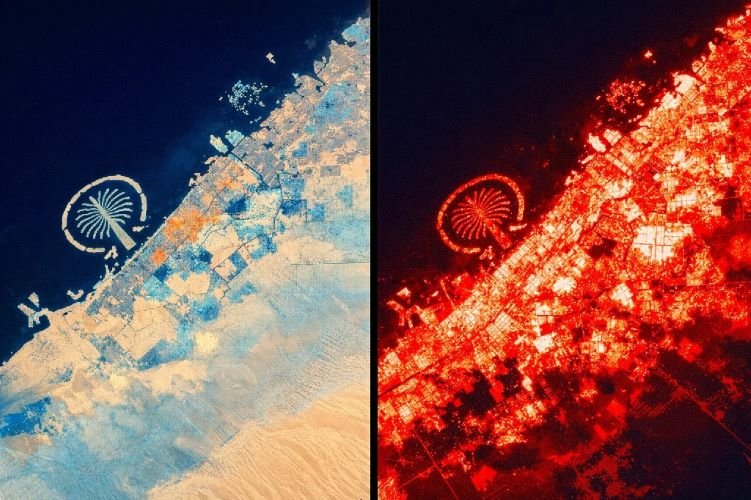
The Landsat satellite program has been acquiring thermal infrared imagery of Dubai since 2000, creating an uninterrupted record of how the city’s land surface temperature has evolved alongside its physical expansion. What that record shows is unambiguous.
In 2000, thermal hotspots were concentrated in Dubai’s historic commercial core — a relatively compact zone surrounded by large desert buffer areas with low surface temperatures. By 2013, as Dubai Marina, Jumeirah Lakes Towers, and the early phases of Downtown Dubai came online, the high-LST zone had expanded dramatically along the coastline. By 2019, the minimum LST recorded across study zones had reached 40.6°C. By 2022, the maximum had climbed to 51.8°C — and the thermal footprint of the city had become essentially continuous across the entire developed coastline, with only the waters of the Persian Gulf providing consistent thermal relief in the satellite imagery.
This is not an abstraction. Each phase of Dubai’s development — Palm Jumeirah, Business Bay, the expansion of Sheikh Zayed Road — is legible in the thermal record as a new zone of elevated surface temperature. The satellite saw it happening in real time, acquisition by acquisition, year by year, long before any ground-based monitoring network could have documented it at this scale.
The Night That Never Cools — Dubai’s UHI After Sunset
In temperate cities, the urban heat island effect typically modulates significantly after sunset. Surfaces cool, temperatures drop, and residents get some thermal respite before the next day’s heat builds again. Dubai’s UHI behavior is different in a way that makes it physiologically significant.
Research analyzing five years of hourly weather station data across urban, suburban, and rural monitoring points in Dubai found that nighttime UHI intensity averages 3.3°C — and that this nocturnal warming is particularly driven by sea breeze patterns and hot desert air from the southwest. Critically, Dubai’s summer nights see relative humidity reaching 100%, making the combination of elevated temperatures and maximum humidity a condition where the human body’s heat dissipation mechanisms become severely impaired. The city’s 3.48 million residents spend their nights in apartments cooled by air conditioning systems working against both the daytime heat stored in building materials and the elevated nighttime ambient temperatures produced by the urban heat island in Dubai.
The thermal consequence of this cycle is measurable from space: ECOSTRESS imagery shows that urban surfaces in Dubai retain significantly higher temperatures well past midnight compared to suburban and rural zones, confirming that nighttime cooling is structurally insufficient in the densest parts of the city.
The Energy Consequence — How the Heat Island Drives Dubai’s Power Demand
Every additional degree Celsius of ambient temperature translates to a 0.5% to 8.5% increase in peak electricity demand. In a city where the building sector is the largest consumer of energy in the emirate and where cooling loads represent a dominant fraction of total energy use, the urban heat island is not merely an environmental or public health problem — it is a structural driver of energy infrastructure stress.
Research modeling combined thermal remote sensing data with building energy simulation across Downtown Dubai found that implementing cool materials and increased urban vegetation together could reduce cooling energy demand by 17.2% to 36.4% depending on building type and insulation level. A separate study showed that increasing urban albedo from 0.2 to 0.8 — essentially switching from dark heat-absorbing surfaces to reflective ones — significantly lowers both the urban heating effect and building cooling needs across the district.
These are not theoretical gains. They are achievable outcomes — but only if decision-makers know precisely where to intervene. Satellite thermal imaging for urban planning produces exactly that map: the spatial distribution of surface temperatures, the correlation with vegetation density, and the identification of which streets, rooftops, and districts would produce the highest return from cooling interventions.
| Metric | Dubai | Global City Average |
|---|---|---|
| Summer base air temperature | 38–41°C (100–106°F) | 25–32°C (77–90°F) |
| Daytime UHI intensity vs. rural | 3.5°C – 4.5°C | 2°C – 3°C |
| Nighttime UHI intensity | 3.3°C (with 100% humidity) | 1°C – 2°C |
| Max land surface temperature (satellite) | 51.8°C (Landsat, 2022) | 35°C – 45°C |
| Annual urban expansion rate (1990–2017) | 17% | 2% – 5% |
| Annual green area expansion (same period) | 0.18% | 1% – 3% |
Dubai 2040 — The Master Plan That Needs Satellite Intelligence to Succeed
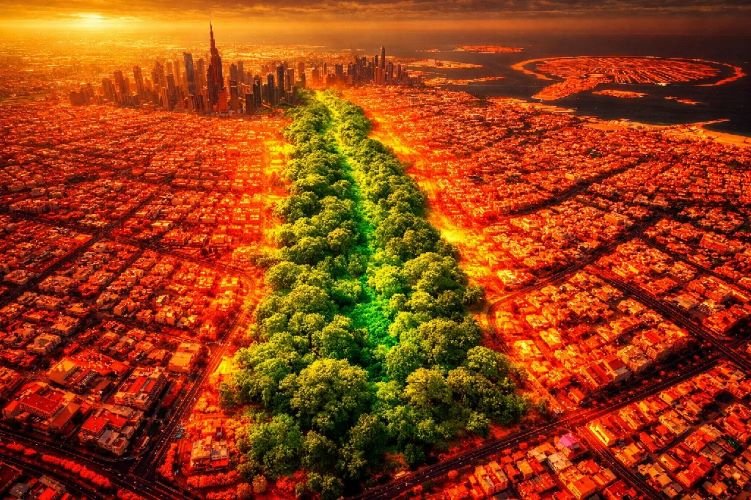
In 2021, Dubai launched its most ambitious urban development framework to date: the Dubai 2040 Urban Master Plan. Among its central commitments is an explicit mandate to combat the urban heat island in Dubai — through doubled green and recreational areas, urban corridors designed for natural cooling, and the flagship Green Spine project that will transform a major expressway into a living green corridor featuring over one million trees, heat-resistant pavements, cycling infrastructure, and solar energy systems.
By 2040, Dubai’s population is projected to grow from 3.3 million to 7.8 million residents. The Dubai 2040 plan designates 60% of the emirate’s total land area as nature reserves and rural natural areas, commits to doubling public parks, and introduces shaded pedestrian zones and green corridors linking residential areas, workplaces, and service centers. The Dubai Municipality’s existing Green Building Regulations already mandate a Solar Reflective Index of ≥78 for flat rooftops in new construction — a direct urban cooling strategy targeting the thermal contribution of building surfaces.
These are meaningful commitments. But they face a fundamental implementation challenge: how do you verify that cooling interventions are actually producing the thermal outcomes they were designed for? How do you prioritize, across a city expanding toward 7.8 million people, which new development zones need green infrastructure most urgently? How do you measure whether the first kilometers of the Green Spine are cooling the surrounding streets by the degrees projected?
The answer is satellite thermal mapping. Without a continuous, city-scale land surface temperature monitoring program using satellite data, the Dubai 2040 heat mitigation objectives remain aspirational targets without the feedback loop needed to optimize their delivery.
Dubai 2040 Heat Mitigation Objectives — and What Satellite Monitoring Enables
Satellite NDVI + LST analysis verifies whether new green zones are producing measurable surface cooling and tracks vegetation health over time across the entire emirate.
Time-series thermal imagery tracks the cooling effect of each phase of construction, providing objective before/after evidence of LST reduction along the corridor and in surrounding districts.
Satellite land cover change detection monitors whether designated reserve areas are being protected from encroachment and whether their thermal buffer function is being maintained.
LST mapping quantifies the surface temperature differential between treated and untreated surfaces across districts, validating the thermal performance of material upgrades at neighborhood scale.
Pre-development thermal baseline analysis identifies which expansion zones carry the highest heat risk, enabling planners to integrate cooling infrastructure before construction rather than retrofitting afterward.
How Satellite Thermal Mapping Works for Dubai’s Scale and Climate
Land Surface Temperature — Reading Dubai’s Heat District by District
The primary satellites used for thermal remote sensing in Dubai are Landsat 8 and 9, which provide thermal infrared imagery at 30-meter resolution with a 16-day revisit cycle; ECOSTRESS, mounted on the International Space Station, offering 70-meter resolution with the ability to capture diurnal temperature cycles including the critical nighttime UHI behavior; and Sentinel-3, providing open-access regional coverage under the European Copernicus program.
In Dubai’s urban environment, this resolution means the difference between rooftop surfaces in Downtown and the narrow tree-shaded walkways of Al Seef Heritage District is visible and measurable from orbit. A dark asphalt commercial rooftop in Business Bay registers differently from a light-colored residential building in Jumeirah. An artificial canal registers as a thermal relief zone. A highway interchange registers as one of the hottest surfaces in the city. This level of spatial discrimination is what makes satellite data not just scientifically interesting but operationally useful for urban planners and developers.
NDVI Combined with Thermal Data — Pinpointing Where Dubai Needs Green Infrastructure First
The combination of land surface temperature data with NDVI — the vegetation index derived from multispectral satellite bands — is particularly powerful in Dubai because vegetation is scarce enough that its thermal impact is disproportionately large. A single mature tree in a Dubai street canyon produces a measurable cool spot in the LST data. A green corridor produces a thermal anomaly visible from space.
Overlaying NDVI with LST across Dubai produces a precise intervention map: the zones where maximum surface temperature coincides with minimum vegetation density are the highest-priority candidates for green infrastructure investment. For the Dubai 2040 plan, this map is the difference between deploying tree planting programs where they will produce maximum cooling impact and distributing them across the city based on administrative convenience.
Historical Baseline — What 22 Years of Landsat Data Reveals Before Building Anything New
One of the most operationally valuable applications of satellite thermal imaging for Dubai’s future development is pre-construction baseline analysis. Before any new residential or commercial zone in the Dubai 2040 expansion areas breaks ground, historical Landsat imagery can characterize the thermal behavior of that site across two decades — identifying areas of residual desert vegetation that provide natural cooling, zones of already-elevated surface temperature from adjacent urban heat, and land cover patterns that will determine how aggressively heat mitigation infrastructure needs to be integrated into the new development’s design.
This retrospective capability is impossible to replicate any other way. There are no ground sensors that have been monitoring undeveloped Dubai expansion zones since 2000. But Landsat has been — and that archive is available and processable today.
Does Your Dubai Development or City Program Have a Thermal Baseline?
SkyIntelGroup delivers satellite-based urban heat island analysis, land surface temperature mapping, and NDVI-integrated cooling intelligence for municipalities, developers, and sustainability teams across the Gulf region and worldwide.
How SkyIntelGroup Supports Urban Heat Management in Dubai and the Gulf
The satellite platforms and analytical methods that have documented Dubai’s urban heat island growth over 22 years are the same tools SkyIntelGroup deploys as a commercial service for governments, municipalities, developers, and ESG consultancies operating in the Gulf region and globally.
For Dubai Municipality and urban planning teams working within the Dubai 2040 framework, we provide LST time-series analysis that transforms the plan’s heat mitigation objectives into measurable, spatially explicit targets — and the ongoing monitoring needed to verify whether those targets are being met district by district, season by season. For real estate developers building within the emirate’s expanding zones, we deliver pre-construction thermal baselines that identify heat risk before design decisions are locked in, enabling cooling infrastructure to be integrated from the outset rather than retrofitted at greater cost. For ESG directors and sustainability consultants advising organizations with Gulf-region asset exposure, we produce satellite-verified urban heat vulnerability mapping that goes beyond regulatory checkbox compliance into the kind of spatial granularity that investors and rating agencies increasingly require.
Our Smart Cities services are built around the understanding that the fastest-growing cities in the world — Dubai chief among them — cannot manage their thermal environments based on sparse ground station data and periodic field surveys. The scale of the challenge requires satellite coverage. The speed of development requires continuous monitoring. And the ambition of plans like Dubai 2040 requires the feedback loop that only objective, repeated thermal measurement from space can provide.
Frequently Asked Questions
Why is the urban heat island effect particularly severe in Dubai compared to other major cities?
Dubai faces a compounding challenge that most cities do not: its baseline summer climate is already among the most extreme on Earth, with air temperatures regularly exceeding 40°C before any urban amplification. When the urban heat island in Dubai adds 3.5°C to 4.5°C on top of that baseline, the physiological consequences are qualitatively different from a city where UHI takes temperatures from 28°C to 32°C. Additionally, Dubai’s extraordinary rate of expansion — 17% annually between 1990 and 2017 — created a thermal environment where the ratio of heat-absorbing surface to vegetation is among the most imbalanced of any major global city.
What surface temperature can Dubai’s asphalt and rooftops reach in summer according to satellite data?
Landsat thermal analysis has recorded land surface temperatures of up to 51.8°C in Dubai’s urban zones during summer 2022. In dense commercial districts, dark asphalt and roofing surfaces routinely reach temperatures significantly above ambient air temperature — research on residential clusters in Dubai recorded maximum surface temperatures of 55°C during peak summer measurement periods. These figures illustrate why satellite thermal mapping is so operationally valuable: weather stations measure air temperature in shaded locations, systematically underrepresenting the actual thermal load experienced at street level and on building surfaces.
How can satellite thermal analysis support the Dubai 2040 Urban Master Plan’s heat mitigation goals?
The Dubai 2040 plan commits to doubling green areas, building the Green Spine corridor, designating 60% of the emirate as natural reserves, and implementing cooling infrastructure across new development zones designed for a population of 7.8 million. Each of these commitments creates a specific monitoring need: are new green zones actually producing measurable LST reductions? Is the Green Spine delivering the cooling gradient projected into surrounding streets? Are new development zones being built with sufficient green infrastructure to prevent another cycle of UHI intensification? Land surface temperature monitoring from satellites provides the objective, spatially continuous data needed to answer these questions across the entire emirate, not just at individual sensor locations.
What satellite technology is used to map the urban heat island in Dubai?
The primary platforms are Landsat 8 and 9, providing thermal infrared data at 30-meter resolution with a 16-day revisit cycle and a historical archive extending back to 2000 for Dubai; ECOSTRESS, mounted on the ISS, which captures land surface temperature at 70-meter resolution and is particularly valuable for studying Dubai’s nighttime UHI behavior; and Sentinel-3 under the Copernicus program, providing open-access regional thermal coverage. For applications requiring higher spatial resolution, commercial thermal satellites are also available. The combination of these platforms enables both historical analysis and continuous near-real-time monitoring of urban heat island intensity across Dubai’s full geographic extent.
Can satellite data measure whether Dubai’s cooling interventions are actually working?
Yes — and this is one of the most commercially valuable applications of thermal remote sensing for cities with active heat mitigation programs. By comparing LST maps acquired before an intervention — a new park, a reflective pavement program, a green roof district — with imagery from subsequent seasons, analysts can quantify the actual surface temperature reduction achieved. Research using this before/after methodology in Dubai has confirmed cooling effects from vegetation ranging up to 3°C at the neighborhood scale. This objective evidence of intervention effectiveness is increasingly required by ESG investors, regulatory bodies, and municipal accountability frameworks, and it is impossible to produce at city scale through any means other than satellite thermal analysis.
Does the urban heat island in Dubai affect all districts equally?
No, and this is precisely why satellite thermal imaging is more useful than generalized temperature statistics. LST mapping reveals significant intra-city variation: dense high-rise districts with minimal ground-level vegetation — Business Bay, DIFC, parts of Deira — register systematically higher surface temperatures than lower-density residential areas with more green space and proximity to the coast. The sea breeze pattern documented across Dubai also creates distinct thermal gradients between coastal and inland zones. Understanding this spatial heterogeneity is essential for targeting cooling investments where they will produce maximum impact — and it is only visible through spatially continuous satellite data.
Conclusion
The urban heat island in Dubai is not a future risk. It is a present reality, documented in 22 years of satellite thermal records, experienced daily by 3.48 million residents who depend on one of the world’s most energy-intensive air conditioning infrastructures to make an otherwise uninhabitable summer survivable, and projected to intensify as a population of 7.8 million occupies a city that has barely begun the transformation its 2040 master plan envisions.
What has changed — and what makes the moment both urgent and actionable — is the quality and availability of the tools needed to manage that transformation with precision. The Landsat archive already holds the thermal history of every neighborhood Dubai has built since 2000. ECOSTRESS is capturing its nighttime heat behavior today. The combination of land surface temperature monitoring with NDVI vegetation analysis can produce, for any district in the emirate, a map showing exactly where surface temperatures are highest, where vegetation is most absent, and where the next dirham invested in cooling infrastructure will produce the greatest measurable return.
Dubai’s ambitions under the 2040 Master Plan are genuine and substantial. The Green Spine, the doubled park areas, the 60% nature reserve target, the green building regulations — these represent a serious institutional commitment to reversing decades of thermal accumulation. But ambition without measurement is planning without feedback. The satellite data exists. The analytical methodology is proven. The only question is whether the city’s developers, planners, and sustainability teams will integrate satellite thermal mapping into their operational toolkit before the next phase of expansion makes the thermal problem harder to solve, not easier.
At SkyIntelGroup, we work with the organizations that cannot afford to find out about heat problems after the concrete has been poured. Our Smart Cities satellite intelligence services exist precisely for cities like Dubai — growing faster than any monitoring framework designed for slower-moving urban environments can keep pace with, committed to ambitious sustainability targets that require objective verification, and operating in a climate where the margin between manageable heat and genuine danger is measured in fractions of a degree.
Ready to Map Dubai’s Urban Heat Island with Satellite Precision?
From historical thermal baselines to real-time cooling intervention monitoring, SkyIntelGroup delivers the satellite intelligence that turns Dubai’s heat challenge into a manageable, measurable problem.