
The Urban Heat Island Effect in 2026: How Satellite Thermal Mapping Is Helping Cities Fight Back
In the summer of 2024, 16,500 people died across 854 European cities from heat-related causes. Two out of every three of those deaths were directly linked to the urban heat island effect — not just climate change in the abstract, but the specific amplification of heat that happens when millions of people live surrounded by concrete, asphalt, and steel instead of soil and vegetation.
Cities are already 4–6°C warmer than their rural surroundings on average. In some neighborhoods, the gap reaches 10°C or more. And the problem is intensifying: as urban populations grow and natural surfaces continue to be replaced by heat-absorbing infrastructure, urban temperature monitoring becomes not just a sustainability priority but a public health emergency.
What has changed in the last decade is our ability to see the problem with extraordinary precision. Satellite thermal imaging can now map every block of a city — every rooftop, every road, every park — revealing exactly where heat accumulates, where it remains trapped after sunset, and where targeted interventions would deliver the greatest impact. At SkyIntelGroup, we deliver this intelligence commercially to governments, urban planners, and organizations worldwide as part of our Smart Cities geospatial services.
What Is the Urban Heat Island Effect — and Why Is It Getting Worse
The urban heat island effect describes a well-documented phenomenon: cities are consistently warmer than the rural areas surrounding them, and that temperature gap grows as cities expand. The mechanism is straightforward but the consequences are profound.
Natural surfaces — soil, grass, forests, bodies of water — absorb solar radiation during the day and release it slowly, moderated by evapotranspiration and natural cooling cycles. Urban surfaces work differently. Asphalt, concrete, and dark roofing materials absorb between 80 and 95% of incoming solar radiation and convert it directly to heat. They have little capacity to cool through evaporation. They release stored heat slowly through the night, which is why cities often remain dangerously warm long after sunset — precisely the period when the human body needs to recover from daytime heat stress.
Three additional factors compound the effect. Buildings trap radiated heat between their facades, reducing the sky-view factor that would otherwise allow heat to escape. Waste heat from vehicles, air conditioning units, and industrial processes adds a constant anthropogenic heat load. And the near-total absence of vegetation eliminates what would otherwise be a significant natural cooling mechanism: a single mature tree can cool the equivalent of 10 air conditioning units running for 20 hours per day.
The result is measurable and growing. Across 57 major U.S. cities, the urban heat island effect averaged +2.4°F over a ten-year period — but the spread is extreme. Las Vegas warmed by 7.3°F, Washington D.C. by 4.7°F, and Kansas City by 4.6°F. These are not projections. They are recorded temperature increases already affecting residents today. Research published in Nature Climate Change calculated that the total economic cost of climate change for cities this century could be 2.6 times higher when heat island effects are factored in. In European cities alone, UHI-induced mortality carries an economic impact of €192 per urban inhabitant per year.
Why Traditional Temperature Monitoring Fails Cities
The official temperature reading for a city on any given day is almost certainly an underestimate of what residents actually experience. Weather stations are typically located in parks, airports, or open areas deliberately chosen to minimize interference from heat-retaining surfaces. They measure the air in exactly the places where the urban heat island effect is least severe.
The practical consequence is that urban planners, public health officials, and sustainability directors are making decisions based on data that systematically misrepresents the thermal reality of the neighborhoods where people actually live and work. In New York City, the UHI index varies from 4.7°F in cooler census tracts to 13.2°F in the hottest — nearly a threefold difference within the same city. A single weather station cannot capture that range, and the decisions that follow from incomplete data are correspondingly incomplete.
Distributed sensor networks offer better spatial coverage but introduce their own problems. Installing, calibrating, and maintaining hundreds of sensors across a city requires significant ongoing investment. Coverage remains uneven, with wealthier neighborhoods typically better instrumented than the lower-income areas that often experience the most intense heat exposure. And even dense sensor networks provide no historical baseline — they can only tell you what is happening now, not how conditions have changed over years or decades.
| Method | City Coverage | Historical Data | Cost at Scale | Spatial Resolution |
|---|---|---|---|---|
| Weather stations | Partial — biased toward parks | Yes, but point-based only | Low per unit, limited value | Single points |
| Distributed urban sensors | Better but uneven | Only from installation date | High installation + maintenance | Neighborhood level |
| Satellite thermal imaging | Complete — every block | Yes — Landsat archive since 1972 | Fraction of ground methods | Block and building level |
How Satellite Thermal Imaging Maps the Urban Heat Island Effect with Precision
The Technology Behind Land Surface Temperature Monitoring
Satellites equipped with thermal infrared sensors measure the temperature of every surface they pass over — not the air temperature, but the actual surface temperature of asphalt, rooftops, parks, water bodies, and industrial areas. This is more revealing than air temperature because it captures the source of the problem directly. A dark asphalt roof on a summer afternoon can reach 70°C while a park 200 meters away sits at 30°C. The satellite captures both simultaneously, along with everything in between, producing a complete thermal map of the city in a single pass.
The primary platforms used for land surface temperature monitoring in urban environments are Landsat 8 and 9 (operated by NASA and USGS), which provide 30-meter resolution thermal data on a 16-day revisit cycle; ECOSTRESS, mounted on the International Space Station, which offers 70-meter resolution with much higher temporal frequency and the ability to capture diurnal temperature variations; and Sentinel-3, operated by the European Space Agency under the Copernicus program, providing open-access global coverage. Together, these platforms give analysts a continuously updated, multi-decade thermal record of virtually every city on Earth.
NDVI + Thermal — The Combination That Turns Data into Action
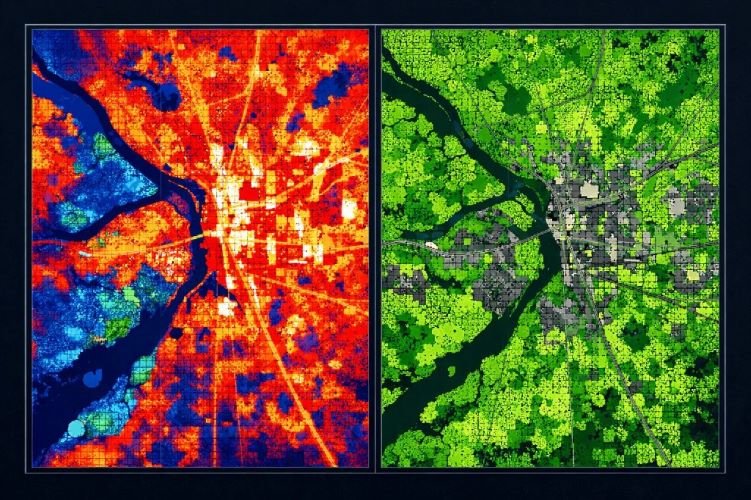
Raw thermal data tells you where a city is hot. The combination of land surface temperature monitoring with NDVI — the Normalized Difference Vegetation Index derived from multispectral satellite imagery — tells you why it is hot and precisely where intervention will be most effective.
NDVI measures vegetation density from space. When overlaid with LST data, it produces a decisive map: zones of maximum temperature coinciding with minimum vegetation are the priority intervention areas. A planner working with this combined dataset can identify which neighborhoods should receive street tree planting first, which rooftops are candidates for green infrastructure for heat reduction, and which districts would benefit most from reflective pavement programs — all before a single euro or dollar is spent on the ground.
This is the critical difference between awareness and action. Most cities today are aware they have an urban heat island effect. Very few have the spatial precision to know exactly where to intervene for maximum impact per unit of investment.
40 Years of Thermal History — Landsat’s Irreplaceable Archive
One of the most powerful and least discussed capabilities of satellite thermal imaging for urban planning is its historical depth. The Landsat program has been collecting thermal data since 1972. For any city in the world, that means a continuous record of surface temperature evolution spanning more than five decades — showing not just what the heat island looks like today but how it has developed as the city has grown, where it has intensified, and which interventions have demonstrably reduced it.
No ground-based monitoring network can offer this retrospective capability. You cannot go back and install sensors in 1990. But you can analyze Landsat data from 1990 and compare it directly to today, understanding exactly how your city’s thermal landscape has changed and which land cover transformations drove those changes.
From Raw Data to Actionable Intelligence: How Satellite UHI Analysis Works
Landsat, ECOSTRESS, or Sentinel-3 captures thermal infrared imagery of the city, measuring surface temperature at block and building level across the entire urban area in a single pass.
Raw thermal bands are processed using calibrated algorithms to produce accurate LST maps, corrected for atmospheric effects and surface emissivity variations across urban materials.
Multispectral imagery is processed to derive NDVI, quantifying vegetation density across the city. Combined with LST, this identifies zones where low greenery and high temperature coincide — the highest-priority intervention areas.
Thermal data is cross-referenced with population density, socioeconomic indicators, and green space access to produce heat vulnerability maps that identify which communities face the highest risk from extreme heat events.
Analysis identifies specific streets, districts, and rooftop zones for targeted cooling strategies: tree planting corridors, cool pavement priority routes, green roof candidates, and urban water body placement.
Repeat satellite acquisitions after interventions quantify their thermal impact with before/after LST comparisons — providing objective evidence of cooling effectiveness to justify investment and guide next phases.
Cities That Are Using Satellite Data to Fight the Heat — and Winning
Phoenix, Arizona — 120 Miles of Cooler Streets, Guided by Thermal Data
Phoenix is the hottest major city in the United States and one of the most intensively studied urban heat islands in the world. When the city launched its Cool Pavement Pilot Program in 2020 in partnership with Arizona State University, thermal satellite data and ground-level instrumentation were central to identifying which streets and neighborhoods to prioritize.
The results validated the approach. Over 120 miles of neighborhood roads were coated with reflective CoolSeal material, producing measured surface temperature reductions of 10–16°F compared to untreated asphalt — and up to 20°F compared to traditional black-coat asphalt. The economic implications are substantial: city analysis showed that a single degree Fahrenheit reduction in summer air temperature could save residential ratepayers approximately $15 million per year in avoided air conditioning costs. Cool pavement is now a permanent part of Phoenix’s street maintenance program, scaled from a pilot to a citywide strategy using the data as the guide.
Los Angeles — Thermal Maps That Revealed Where Heat Actually Lives
When Los Angeles developed its Cool Streets LA program, thermal satellite and aerial analysis produced a counterintuitive finding: the most intense heat was not concentrated along major highways as planners had assumed, but in dense residential streets in specific inland neighborhoods. That insight changed the intervention strategy entirely.
The city deployed 200 blocks of reflective cool pavement and planted nearly 2,000 new trees in high-exposure neighborhoods identified through satellite thermal imaging for urban planning. Treated streets recorded surface temperatures approximately 10°F cooler than adjacent untreated streets — a reduction confirmed both by roadside sensors and follow-up satellite thermal acquisition. The program continues to scale based on thermal data that updates as new satellite imagery becomes available.
Seville — Seven Years of Satellite Monitoring to Evaluate Green Infrastructure
Researchers at the University of Seville used Sentinel-3 and Landsat 8 data spanning 2015 to 2022 to evaluate the thermal effectiveness of the city’s «Verde tu Barrio» (Green Your Neighborhood) urban greening plan. The satellite time series provided something no ground-based study could: a complete spatial picture of how surface temperatures evolved across the entire city as vegetation was added in specific areas.
The findings were nuanced and precisely the kind of intelligence that makes urban heat island mitigation strategies more effective rather than less: localized greening interventions produced measurable local cooling, but their impact on citywide temperatures was limited without a coordinated metropolitan-scale strategy. That conclusion — only possible through multi-year land surface temperature monitoring from space — directly informed the next phase of Seville’s urban heat planning.
Who Needs Urban Heat Island Mapping — and What They Do with It
The applications of satellite thermal imaging for urban planning extend across several decision-making contexts, each with distinct needs and distinct ways of translating thermal intelligence into action.
How SkyIntelGroup Delivers Urban Heat Island Intelligence Globally
The satellite data that guided Phoenix’s cooling program and Seville’s greening evaluation is the same data SkyIntelGroup processes commercially for governments, municipalities, and organizations anywhere in the world. Our urban heat island mapping with satellite imagery service combines Landsat, Sentinel, and ECOSTRESS thermal data with NDVI analysis to deliver not raw imagery but finished intelligence: maps showing exactly where your city’s heat is concentrated, how it has evolved over time, which areas carry the highest vulnerability, and where intervention investment will produce the most measurable cooling.
We work without the need for any ground infrastructure installation. There are no sensors to deploy, no maintenance contracts, no gaps in coverage because a station went offline. The satellite archive already contains your city’s thermal history. What smart city solutions require today is not more data collection — it is the analytical capability to extract actionable intelligence from what already exists.
Whether you need a one-time historical analysis to understand how your city’s urban heat island effect has evolved over decades, a thermal hotspot assessment to guide a specific green infrastructure program, or continuous monitoring to track the impact of cooling interventions as they are implemented, our team delivers results at the spatial precision and temporal depth that ground-based methods cannot match.
Does Your City Know Where Its Heat Is Coming From?
SkyIntelGroup delivers satellite-based urban heat island mapping, land surface temperature analysis, and NDVI-integrated intervention planning for municipalities, developers, and sustainability teams worldwide.
Frequently Asked Questions
How much hotter is a city compared to its surrounding rural areas because of the urban heat island effect?
The average temperature difference is 4–6°C, but the range varies significantly depending on city size, density, and the proportion of green space. Surface temperatures — what satellites measure on rooftops and roads — can be 10–15°C higher than in adjacent rural areas, particularly during summer afternoons. Within a single city, the variation can be equally extreme: in New York City, the UHI index ranges from 4.7°F in cooler census tracts to 13.2°F in the hottest, meaning that two neighborhoods a few kilometers apart can experience dramatically different heat exposure on the same day.
What satellites are used to map urban heat islands?
The primary platforms for land surface temperature monitoring in cities are Landsat 8 and 9, operated by NASA and USGS, which provide 30-meter resolution thermal data with a 16-day revisit cycle; ECOSTRESS, mounted on the International Space Station, which offers 70-meter resolution with higher temporal frequency; and Sentinel-3, operated by the European Space Agency under Copernicus, providing open-access global coverage. For cities requiring higher spatial resolution, commercial thermal satellites are also available. Each platform has different trade-offs between resolution, revisit frequency, and archive depth.
How far back does satellite thermal data for cities go?
The Landsat archive extends to 1972, making it the longest continuous record of surface temperature available for any location on Earth. For practical urban heat island effect analysis — comparing how a city’s thermal landscape has changed as it has grown — usable thermal data extends comfortably to the 1980s and 1990s for most cities worldwide. This historical depth is one of the defining advantages of satellite-based analysis over ground-based monitoring, which can only provide data from the date of installation.
Can satellite data measure whether a cooling intervention actually worked?
Yes, and this is one of the most valuable applications of satellite thermal imaging for urban planning. By comparing LST maps acquired before an intervention — such as a tree planting program, cool pavement deployment, or green roof installation — with imagery acquired in subsequent seasons, analysts can quantify the actual surface temperature reduction achieved. This before/after comparison provides objective evidence of cooling effectiveness that neither visual inspection nor isolated sensor readings can deliver, and it works at the scale of entire neighborhoods rather than individual measurement points.
How does SkyIntelGroup deliver urban heat island analysis?
We process thermal satellite imagery from Landsat, Sentinel, and ECOSTRESS to produce land surface temperature maps, NDVI-integrated hotspot analyses, heat vulnerability mapping, and multi-year trend assessments for cities and organizations globally. No ground infrastructure is required. Deliverables are designed for use by planning teams, sustainability officers, and decision-makers who need clear spatial intelligence rather than raw remote sensing data. You can reach our team directly through our Smart Cities services page or via WhatsApp.
Ready to Map Your City’s Heat Island?
From historical thermal analysis to continuous monitoring and intervention planning, SkyIntelGroup delivers the satellite intelligence that turns urban heat data into actionable decisions.