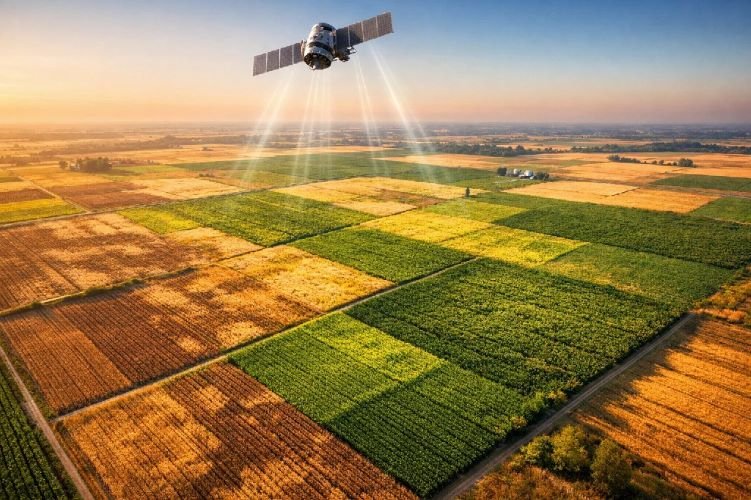
How to Monitor Crop Health Using Satellites in 2026: A Complete Guide
Crop stress doesn’t announce itself. By the time you spot yellowing leaves or patchy growth from the ground, you’ve likely already lost a significant portion of your yield. Research consistently shows that undetected stress events account for 15 to 25% of annual yield losses in large-scale operations. The good news? Today, knowing how to monitor crop health using satellites gives farmers and agribusinesses a decisive edge — detecting problems weeks before they become visible, at a fraction of the cost of traditional field scouting.
This guide breaks down exactly how satellite-based crop health monitoring works in 2026, which technologies and indices matter, and how to turn raw satellite data into actionable farm decisions.
Why Satellite Monitoring Is the Standard for Crop Health in 2026
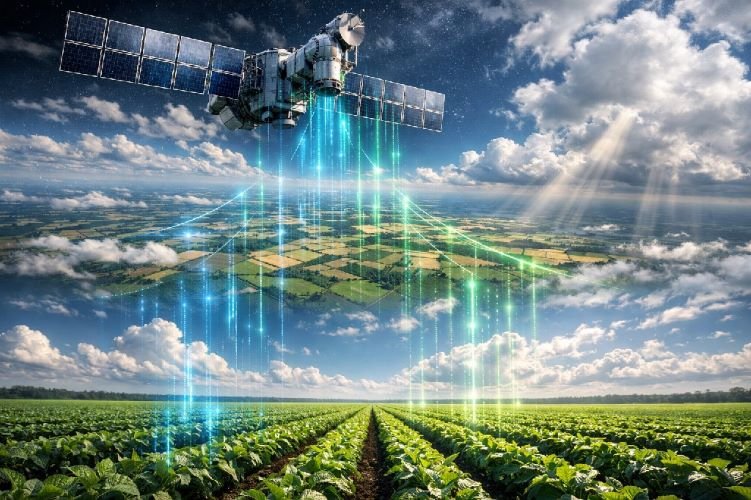
The shift from walking fields to observing them from orbit didn’t happen overnight — but it has accelerated dramatically. Satellites like Sentinel-2, Landsat-8, and PlanetScope now provide frequent, high-resolution imagery at costs that were unthinkable a decade ago. Sentinel-2 revisits any point on Earth every 5 days at 10-meter resolution — for free. PlanetScope does it daily.
For large farms, agribusinesses, and agricultural insurers, remote sensing in agriculture has moved from experimental tool to operational standard. The question is no longer whether to use satellite data, but how to use it effectively.
Key Satellite Technologies Used to Monitor Crop Health
Not all satellites see the same thing. Choosing the right sensor depends on your crops, your location, and what you’re trying to detect.
Multispectral Imaging
The backbone of satellite imagery for agriculture. Multispectral sensors capture light across multiple bands — including visible red, green, blue, and near-infrared (NIR) — that the human eye can’t see. Plants reflect NIR strongly when healthy and absorb it under stress, making these invisible bands the most reliable signal of crop condition. Satellites like Sentinel-2 and Landsat-8 use multispectral imaging to generate the vegetation indices that drive most precision agriculture decisions today.
Thermal Infrared Imaging
Plants under water stress close their stomata to conserve moisture — and in doing so, their surface temperature rises. Thermal sensors detect these temperature anomalies, flagging drought stress and irrigation inefficiencies before any visual symptom appears. Particularly useful for irrigation scheduling in water-scarce regions.
SAR — Synthetic Aperture Radar
Cloud cover is the enemy of optical satellites. SAR solves this by sending its own microwave pulses toward the surface and measuring the return signal — completely independent of sunlight or cloud conditions. This makes SAR (Sentinel-1 is the most widely used) indispensable for continuous monitoring in tropical or frequently overcast agricultural regions.
Multispectral Imaging
Captures NIR, red, green and SWIR bands. Detects plant stress through light reflectance changes invisible to the naked eye.
Sentinel-2 · Landsat-8 · PlanetScopeThermal Infrared
Detects surface temperature anomalies caused by water stress and stomatal closure. Key for precision irrigation decisions.
Landsat-8/9 · ECOSTRESSSAR Radar
Penetrates clouds and works at night. Provides continuous monitoring regardless of weather — critical for tropical regions.
Sentinel-1 · ALOS-2The Vegetation Indices That Tell You What’s Happening in Your Field
Satellite sensors collect raw data — vegetation indices transform that data into actionable intelligence. Here are the four you need to know:
| Index | What It Measures | Best Use Case | Key Limitation |
|---|---|---|---|
| NDVI Most Used | Overall plant vigor and vegetation density | General crop health monitoring throughout the season | Saturates in dense canopies; affected by soil background in early growth stages |
| EVI | Vegetation health with atmospheric correction | Regions with frequent cloud cover, smoke or dust | More complex to compute; less widely supported in basic platforms |
| SAVI | Crop health adjusted for soil reflectance | Early-season monitoring when canopy cover is low | Requires calibration for different soil types |
| NDWI | Water content in plant canopy and soil | Irrigation scheduling and drought stress detection | Less effective in areas with mixed vegetation types |
The NDVI remains the dominant index — it’s used in 77% of agricultural insurance products globally. But choosing the right index for your crop type, growth stage, and climate is where the real expertise lies.
Step-by-Step: How to Monitor Crop Health Using Satellites
Here’s the practical workflow used in professional satellite crop monitoring projects.
Step 1 — Define Your Area of Interest
Before any satellite is tasked or data acquired, you need precise field boundaries. This process — known as field delineation — defines exactly which parcels will be monitored. Modern AI-based segmentation tools can automate this from existing satellite imagery, eliminating manual digitization. The more accurate your AOI, the more precise and cost-efficient your monitoring will be.
Step 2 — Select the Right Satellite and Sensor
There’s no single «best» satellite. The right choice depends on what you need:
- Sentinel-2 — Free, 10m resolution, 5-day revisit. Ideal baseline for most operations.
- PlanetScope — 3–5m resolution, daily revisit. Best for detecting rapid changes and disease outbreaks.
- Sentinel-1 (SAR) — All-weather, cloud-penetrating. Essential for tropical or monsoon regions.
- Landsat-8/9 — Free, 30m resolution, thermal bands available. Useful for soil moisture and irrigation analysis.
Step 3 — Acquire and Process the Imagery
Raw satellite data isn’t analysis-ready. It requires atmospheric correction, band calibration, and index calculation before it becomes interpretable. This is the technical processing step where the vegetation indices (NDVI, EVI, SAVI, NDWI) are computed from the raw spectral reflectance data.
Step 4 — Interpret the Results and Take Action
A processed NDVI map uses a color scale from red (stressed/low vigor) to dark green (healthy/high vigor). The goal isn’t just to see the map — it’s to correlate the anomalies with field realities: are the red zones near the irrigation system edge? Near a drainage problem? Downwind from a disease focus? Interpretation is where satellite data becomes farm intelligence.
Step 5 — Set Up Recurring Monitoring
A single image captures a moment. A time-series captures a story. Recurring monitoring — weekly or bi-weekly during the growing season — allows you to track crop development against historical baselines, detect emerging stress trends, and forecast yield outcomes. This is the setup that delivers real ROI.
What Can You Actually Detect? Real Applications in the Field
Crop monitoring using remote sensing isn’t limited to checking if plants are green. These are the concrete problems it solves:
🌿 Nutrient Deficiencies
NDVI and red-edge indices flag chlorophyll drops days before symptoms appear, enabling targeted fertilizer application.
🦠 Disease & Pest Outbreaks
Spectral anomaly detection achieves up to 92% accuracy in identifying disease pressure early — saving up to 40% of affected plantations.
💧 Water Stress & Irrigation Gaps
NDWI and thermal indices guide irrigation scheduling, reducing water use by 20–30% without sacrificing yield.
📈 Yield Forecasting
Time-series NDVI combined with ML models predicts crop yield up to one month before harvest with R² accuracy between 0.4 and 0.88.
🌍 Soil Subsidence
DInSAR technology detects millimeter-level ground sinking caused by aquifer depletion — a unique capability most ag monitoring providers don’t offer.
How Much Does Satellite Crop Monitoring Cost?
This varies significantly depending on the scope and data source:
- Free data (Sentinel-2, Landsat-8/9): Available publicly but requires technical processing capability.
- Commercial imagery (PlanetScope, WorldView): Subscription or per-km² pricing — PlanetScope annual plans start around $9,650 for monitoring packages.
- Professional analysis services: What most agribusinesses actually need — processed data, interpreted results, and actionable recommendations delivered as reports and georeferenced maps.
The ROI equation is straightforward: if satellite monitoring prevents even a 10% yield loss on a 500-hectare operation, the savings vastly outweigh the service cost. Agricultural insurance companies have recognized this — NDVI-based verification is now the standard in index-based insurance products globally.
Want to know if this works for your operation?
At Sky Intel Group we analyze your specific crop, region and monitoring needs before recommending any solution. No generic packages — just the right data for your fields.
Do You Need to Install Any Equipment on Your Farm?
No. This is one of the most common misconceptions — and one of the biggest advantages of satellite-based monitoring.
There is no hardware to install, no sensors to maintain, and no need for physical access to your fields. Sky Intel Group’s analysis team acquires satellite imagery remotely, processes it off-site, and delivers results as georeferenced maps and actionable reports. The service works for any farm, anywhere in the world — from a 200-hectare soy operation in Brazil to a 5,000-hectare wheat farm in Kazakhstan.
This «zero footprint» approach also means monitoring is not disrupted by operational activity, security restrictions, or remote location. If there’s a satellite that can see it — and there is — we can monitor it.
Sky Intel Group’s Approach to Satellite Crop Health Monitoring
At Sky Intel Group, crop health monitoring is not a dashboard subscription — it’s a professional analysis service. Here’s what that means in practice:
We work with Sentinel-2, Landsat-8, and PlanetScope imagery depending on the required spatial resolution and revisit frequency. Our analysts select the appropriate vegetation index for your specific crop type and growth stage — not just the default NDVI. For operations in cloud-prone regions, we integrate SAR data from Sentinel-1 to ensure continuity of monitoring regardless of weather.
Every project delivers:
- Georeferenced NDVI and multispectral maps in GIS-compatible formats
- Temporal series analysis showing crop evolution across the season
- Written interpretation with zone-by-zone agronomic recommendations
- Alerts for emerging stress areas requiring ground-level verification
Beyond standard NDVI monitoring, Sky Intel Group offers a capability that very few providers in the market have: DInSAR-based soil subsidence monitoring for agricultural zones. If your operation relies on groundwater extraction, this service detects millimeter-level ground sinking that signals aquifer depletion — protecting both infrastructure and long-term soil productivity.
Learn more about our full range of services on our Agriculture services page.
What You Get with Every Sky Intel Group Crop Monitoring Project
- Georeferenced NDVI & multispectral maps (GIS-compatible)
- Temporal series analysis of crop development across the season
- Written interpretation with zone-by-zone agronomic recommendations
- Stress zone alerts for targeted field verification
- Global coverage — any crop, any region, fully remote
Frequently Asked Questions
What satellites are used to monitor crop health?
The most commonly used satellites for crop health monitoring are Sentinel-2 (10m resolution, 5-day revisit, free), Landsat-8/9 (30m resolution, thermal bands, free), and PlanetScope (3–5m resolution, daily revisit, commercial). For continuous monitoring in cloudy or tropical regions, Sentinel-1 SAR provides all-weather, day-and-night coverage. The right choice depends on the crop type, field size, required temporal frequency, and specific monitoring objective — a professional service will select the optimal combination.
How often can satellites monitor my fields?
Revisit frequency varies by satellite: Sentinel-2 covers the same area every 5 days, PlanetScope does it daily, and Sentinel-1 SAR revisits every 6–12 days depending on latitude. In practice, professional monitoring programs combine multiple satellites to achieve effective revisit rates of 2–3 times per week during critical growing stages — enough to detect rapid changes like disease onset or irrigation failure before they spread.
Can satellite monitoring detect crop diseases early?
Yes — and this is one of its most valuable capabilities. Diseased plants alter their spectral reflectance before any visible symptom appears. By comparing current imagery against temporal baselines and flagging anomalies, satellite analysis can detect disease pressure 7 to 14 days earlier than ground scouting. Research has demonstrated detection accuracy of up to 92% for specific stress patterns using multitemporal analysis combined with AI classification.
Is satellite crop monitoring available worldwide?
Yes. Satellites don’t have borders. Sky Intel Group can monitor agricultural operations in any country — from large soy estates in South America and wheat farms in Eastern Europe to smallholder cooperatives in Sub-Saharan Africa. The only requirement is a defined area of interest and the objectives you want to achieve. No physical presence is needed on our part or yours.
What’s the difference between satellite monitoring and using a precision agriculture app?
Most precision agriculture apps (Farmonaut, EOSDA Crop Monitoring, OneSoil) are subscription platforms that give you access to pre-processed satellite data through a standardized interface. A professional satellite intelligence service like Sky Intel Group provides customized analysis tailored to your specific crop, region, stress history, and operational needs — including advanced capabilities like DInSAR subsidence monitoring that no off-the-shelf app offers. The difference is between reading a weather app and hiring a meteorologist.
How do I get started with satellite crop health monitoring?
The first step is defining your monitoring objectives: Are you tracking general crop health? Optimizing irrigation? Preparing for insurance verification? Each objective determines the satellite, index, and frequency. Contact Sky Intel Group through our contact page and we’ll recommend the right approach for your operation — no commitment required for the initial consultation.
Ready to Monitor Your Crops from Space?
Sky Intel Group delivers professional satellite crop health analysis for operations of any size, anywhere in the world. Let’s talk about your fields.