Crop Monitoring Using Remote Sensing: Methods, Tools & Real Results (2026)
Remote sensing data volume in agriculture is set to increase fourfold between 2023 and 2026. That’s not a future projection anymore — it’s happening now, and the operations that understand how to turn satellite data into farm decisions are pulling ahead. Crop monitoring using remote sensing has evolved from an experimental research tool into the operational backbone of modern precision agriculture, enabling continuous, non-destructive, and scalable analysis of crop conditions across any field, anywhere in the world.
This guide covers the core methods, the platforms that deliver them, real quantified results from recent research, and the honest limitations no one talks about.
Why Remote Sensing Has Become the Standard for Crop Monitoring
Traditional field surveys are slow, expensive, and spatially limited. A scout walking a 500-hectare field captures a snapshot — subjective, labor-intensive, and always arriving after the problem has already developed. Remote sensing in agriculture inverts this model entirely.
Satellite-driven monitoring delivers spatial and temporal data at scales that ground methods simply cannot match. It allows concurrent monitoring of crop condition, soil moisture, disease pressure, and water stress — not once a season, but continuously throughout the growing cycle. For agronomists, farm managers, and agribusiness executives managing large operations, this shift from reactive to proactive management is where the real economic value lives.
The 3 Core Methods Used in Crop Monitoring Using Remote Sensing
Not every method answers every question. Choosing the right approach depends on the objective, the crop type, and the operational scale.
Multispectral and Hyperspectral Imaging
The operational workhorse of crop health monitoring using remote sensing. Multispectral sensors capture 3 to 10 broad spectral bands — including visible red, green, blue, near-infrared (NIR), and shortwave infrared (SWIR) — revealing information about plant physiology that the human eye cannot detect. Healthy plants absorb red light for photosynthesis and strongly reflect NIR; stressed plants reverse this pattern, creating detectable spectral anomalies.
Hyperspectral imaging takes this further, capturing hundreds of narrow spectral bands and enabling more precise measurement of biophysical parameters like chlorophyll content, leaf area index (LAI), and canopy structure. However, hyperspectral remains primarily a research-grade tool due to complex calibration requirements — for most commercial agricultural operations, high-resolution multispectral imagery is the practical standard.
Thermal Infrared Imaging
Plants under water stress close their stomata to conserve moisture. This reduces transpiration and causes leaf surface temperature to rise — a signal that thermal sensors detect before any visual symptom appears. Thermal imaging is the foundation of precision irrigation scheduling, identifying water-deficit zones across entire fields and enabling targeted intervention that reduces water use by 20–30% without sacrificing yield.
SAR — Synthetic Aperture Radar
Cloud cover is agriculture’s monitoring blind spot. SAR eliminates it entirely. By emitting its own microwave pulses and measuring the return signal, SAR operates completely independently of sunlight or atmospheric conditions. This makes Sentinel-1 SAR indispensable for tropical regions, monsoon climates, and any operation where optical satellites are regularly blocked by cloud cover. SAR data relates to structural properties of vegetation rather than chemical ones — making it the ideal complement to optical multispectral imagery rather than a replacement for it.
Multispectral & Hyperspectral
Captures NIR, SWIR and red-edge bands invisible to the human eye. Detects chlorophyll stress, LAI, nutrient deficiencies and biomass changes.
Operational StandardThermal Infrared
Measures leaf surface temperature to detect stomatal closure and water stress. Triggers precision irrigation before visual symptoms appear.
Irrigation OptimizationSAR Radar
Cloud-penetrating microwave pulses provide all-weather, day-and-night monitoring. Captures vegetation structure independently of optical conditions.
All-Weather CoveragePlatforms and Tools: Satellites, Drones, and When to Use Each
Three technological pillars support modern agricultural satellite imagery programs. They don’t compete — they complement each other at different scales and resolutions.
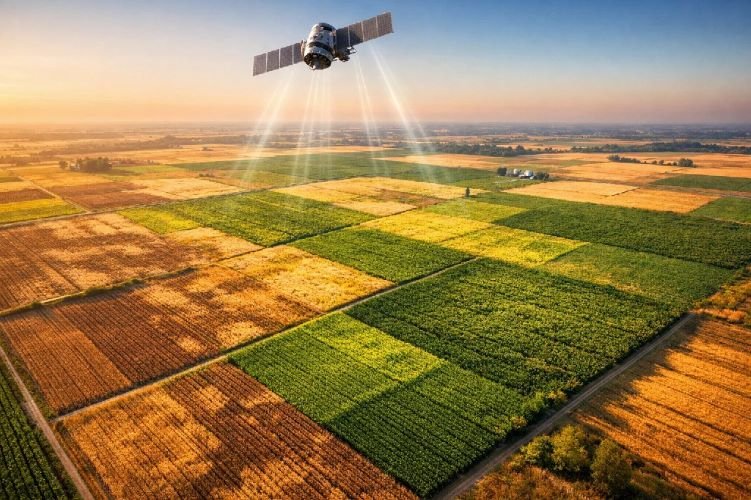
Satellites — Global Coverage and Long Time Series
The foundation of any large-scale crop monitoring program. Freely available platforms like Sentinel-2 and Landsat-8/9 have democratized access to multispectral imagery at resolutions and revisit rates that were commercially unthinkable a decade ago. Commercial constellations like PlanetScope push daily revisit rates and sub-5m resolution for operations requiring higher temporal or spatial detail.
Drones / UAVs — Centimeter-Level Resolution on Demand
Where satellites provide scale, drones provide depth. Equipped with multispectral, thermal, or LiDAR sensors, UAVs deliver centimeter-level imagery for targeted field inspection — ideal for verifying anomalies flagged by satellite analysis or monitoring smaller fields where satellite resolution is insufficient. The trade-off: operational costs range from $500 to $2,000 per km² according to recent research (Frontiers, 2026), making large-scale drone monitoring economically prohibitive without satellite as the primary layer.
Multimodal Fusion — The Approach That Delivers the Best Results
Combining satellite imagery with UAV data, meteorological records, soil properties, and elevation models produces significantly better outcomes than any single data source. Research published in Frontiers (2026) confirmed that UAV-satellite data fusion improves crop yield prediction accuracy to R²=0.83. Studies in Argentina and Germany showed that adding elevation data or soil properties to satellite imagery improved yield prediction precision by 8 to 13 percentage points depending on the crop and region.
| Platform | Resolution | Revisit Rate | Key Bands | Cost | Best For |
|---|---|---|---|---|---|
| Sentinel-2 | 10–60 m | Every 5 days | Multispectral + Red-Edge | Free | General crop health, NDVI time series |
| Landsat-8/9 | 30 m (15 m pan) | Every 8–16 days | Multispectral + Thermal | Free | Thermal irrigation analysis, long archives |
| PlanetScope | 3–5 m | Daily | Multispectral | Commercial | Rapid change detection, disease outbreaks |
| Sentinel-1 SAR | 5–20 m | Every 6–12 days | C-band microwave | Free | All-weather monitoring, tropical regions |
| UAV / Drone | <10 cm | On demand | Multispectral / Thermal / LiDAR | $500–2K/km² | Targeted verification, small field detail |
Vegetation Indices: The Language of Remote Sensing Crop Analysis
Raw satellite imagery is data. Vegetation indices are what transform that data into agronomic intelligence. Here are the five most used in professional precision agriculture remote sensing programs — including one that most platforms overlook:
The right index is not always the most popular one. Selecting the appropriate index for the specific crop type, growth stage, and stress type is where professional analysis adds value beyond what any automated dashboard delivers.
Real Results: What the Data Actually Shows in 2025–2026
This is the section most articles skip. Here are quantified outcomes from verified recent research — no marketing claims, no invented numbers.
These numbers matter because they reflect the actual performance ceiling — and the honest range. Disease detection at 81–95% is powerful, but models must be calibrated for each agroecological zone. A model trained on US Corn Belt data may lose 12–18% accuracy when applied directly to smallholder systems in East Africa without adaptation (Frontiers, 2026). Context always matters.
The Honest Limitations Nobody Talks About
Trustworthy technical guidance includes the full picture.
Temporal resolution is the real bottleneck, not spatial. A week of persistent cloud cover during a critical growth stage can interrupt optical monitoring entirely — not rare in tropical regions or monsoon periods. This is exactly why SAR integration matters.
AI models don’t generalize automatically. Performance degradation of 12–18% has been documented when deep learning models transfer across different agroecological zones without local calibration. Every region, soil type, and crop phenotype introduces variables that require adaptation.
Remote sensing detects stress — it doesn’t always diagnose the cause. A drop in NDVI tells you something is wrong. It doesn’t always tell you whether it’s nutrient deficiency, fungal infection, or pest pressure. Targeted field verification remains essential for precise diagnosis.
Connectivity in remote regions remains a practical barrier. In areas without reliable internet, cloud-processed satellite data isn’t always deliverable in real time — an infrastructure constraint that affects accessibility in many developing regions.
Knowing these limitations doesn’t reduce the value of the technology. It means you use it correctly — and combine it with the right complementary tools.
Want to know which method fits your operation?
Sky Intel Group evaluates your crop type, region, and monitoring objectives before recommending any approach. No standard packages — just the right analysis for your fields.
How Sky Intel Group Applies These Methods in Real Projects
At Sky Intel Group, crop monitoring is not a subscription dashboard — it’s a professional analysis service built around the specific needs of each operation.
We select the satellite platform and sensor combination based on the crop type, regional cloud patterns, and monitoring frequency required — not a default configuration applied to every client. For operations in cloud-prone or tropical regions, Sentinel-1 SAR is integrated from day one to ensure monitoring continuity regardless of weather. For operations requiring high temporal resolution during critical growth stages, PlanetScope daily imagery supplements Sentinel-2’s 5-day cycle.
Index selection follows the same logic. Monitoring a mature wheat field late in the season calls for NDRE over NDVI to avoid canopy saturation effects. Monitoring early-season soy with low canopy cover calls for SAVI to filter soil background noise. These are not details automated platforms handle — they require agronomic judgment.
Beyond standard multispectral analysis, Sky Intel Group offers a capability that very few providers globally can match: DInSAR-based soil subsidence monitoring for agricultural zones dependent on groundwater extraction — identifying aquifer depletion before it compromises soil structure or infrastructure. No off-the-shelf agricultural app offers this.
Every project delivers georeferenced maps in GIS-compatible formats, temporal series analysis, written interpretation, and zone-specific recommendations — not raw data requiring internal expertise to decode.
Explore the full range of services on our Agriculture services page.
Frequently Asked Questions
What is the difference between multispectral and hyperspectral remote sensing for crop monitoring?
Multispectral sensors capture 3 to 10 broad spectral bands and represent the operational standard for commercial agricultural monitoring today — platforms like Sentinel-2 and PlanetScope use multispectral imaging to generate the vegetation indices that drive most precision agriculture decisions. Hyperspectral sensors capture hundreds of narrow spectral bands, enabling more precise measurement of biophysical parameters like chlorophyll content, leaf area index, and specific disease signatures. However, hyperspectral remains primarily a research-grade tool due to complex calibration requirements, high data volumes, and interpretation demands that make it impractical for most commercial operations at scale. For the vast majority of agribusiness monitoring needs, high-resolution multispectral is the right choice.
Can drones replace satellites in crop monitoring using remote sensing?
No — and the most effective programs don’t try to make that choice. Satellites provide global coverage, consistent time series, and low cost per hectare at large scale, making them the foundation of any serious monitoring program. Drones deliver centimeter-level resolution and on-demand flexibility for targeted field inspection — ideal for verifying anomalies flagged by satellite analysis. Research confirms that combining both platforms improves crop yield prediction accuracy to R²=0.83, a result neither platform achieves independently.
Which vegetation index is most accurate for early disease detection?
It depends on the crop and growth stage. For mature crops with dense canopies, NDRE outperforms NDVI because it’s less prone to saturation and more sensitive to early chlorophyll stress changes. For early-season crops with low canopy cover, SAVI provides better accuracy by correcting for soil reflectance interference. For water stress and irrigation needs, NDWI is the appropriate choice. Professional crop monitoring selects the index based on the specific objective — not a one-size-fits-all default.
How long does it take to set up a satellite crop monitoring program?
A professional monitoring program can be operational within days of defining the area of interest. First maps and analysis are typically delivered within 5 to 10 business days of imagery acquisition. Recurring monitoring programs — set up once, running continuously through the season — require an initial configuration period of 1 to 2 weeks. There is no hardware to install, no field access required, and no operational disruption to farming activities.
Is crop monitoring using remote sensing viable for operations in tropical regions with frequent cloud cover?
Yes — specifically because SAR exists. Sentinel-1 operates in C-band microwave, whose pulses penetrate cloud cover completely and work day and night. For tropical regions in Sub-Saharan Africa, Southeast Asia, Central America, or monsoon-affected areas in South Asia, integrating SAR from the start is not optional — it’s essential. Sky Intel Group combines optical multispectral data when skies are clear with SAR when they’re not, guaranteeing continuous monitoring regardless of weather throughout the growing season.
What’s the difference between using a precision agriculture app and hiring a professional satellite analysis service?
Off-the-shelf apps like Farmonaut, EOSDA Crop Monitoring, or OneSoil give you access to pre-processed satellite data through a standardized platform — whatever index the platform calculates, interpreted by your own team. A professional service like Sky Intel Group provides customized analysis: selecting the right satellite, the right index for your specific crop and growth stage, and delivering written interpretation with actionable agronomic recommendations. Beyond standard monitoring, Sky Intel Group offers capabilities no app provides, including DInSAR soil subsidence analysis for agricultural zones with groundwater dependency.
Ready to Start Monitoring Your Crops from Space?
Tell us your crop type, location and monitoring objective. Sky Intel Group will recommend the exact method, platform and deliverable format that fits your operation — no commitment required for the initial consultation.