Early Signs of Crop Disease in the United States: How to Catch the Problem Before It Costs You the Season
You walked the field two weeks ago. Everything looked fine. The stand was good, color was right, no obvious problems. Now there’s a section that’s gone — leaves covered in lesions, the disease already moving into the next rows. You didn’t miss it because you weren’t paying attention. You missed it because by the time crop disease shows up where you can see it from the ground, it’s already been working on your yield for days.
That’s the part nobody talks about enough. The early signs of crop disease in the United States don’t look like anything at first. They happen at a level the eye doesn’t catch — in how the plant is absorbing light, in how its temperature is changing, in patterns across the field that only become visible from above, and only if you know what to look for.
The window between when a disease starts and when it becomes visible is the only window where your response actually changes the outcome. SkyIntelGroup detects that window from satellite imagery — covering every acre of your operation, in any U.S. state, before the first symptom shows on the ground.
What Crop Disease Actually Costs U.S. Farmers Every Year
The losses from crop disease in the United States aren’t headline numbers from disaster years. They’re the background cost of every normal season — what gets quietly subtracted from yield when a problem starts a week before it’s caught, or gets treated in the wrong zone, or gets missed entirely on a field that didn’t get scouted that week.
The 2024 numbers from the Crop Protection Network make that cost concrete. Disease reduced corn yield by an estimated 6% across the U.S. — a loss of 963.4 million bushels in a single season. Soybean disease cost 5.4% of potential production, or 250.9 million bushels. Cotton growers lost an estimated 827,042 bales to disease, also at 5.4% of yield. These aren’t exceptional years. These are the documented baseline losses from diseases that were detected too late, treated too broadly, or missed entirely in fields that couldn’t get full coverage.
The harder truth is that most of these losses didn’t happen because farmers weren’t trying. They happened because the tools available — walking the field, checking problem areas, applying on a calendar schedule — aren’t built to catch a problem before it spreads. They’re built to confirm what’s already there.
The Early Signs of Crop Disease Are There — Just Not Where You’re Looking
Here’s what actually happens when a disease starts in a field. Long before you see a lesion, a spot, or a color change on the leaf, the plant is already responding to the infection. It starts closing down certain processes — chlorophyll production slows, the way the leaf handles moisture changes, the leaf temperature rises slightly. The plant is fighting something, and that fight shows up in how it reflects light across wavelengths your eyes don’t see.
By the time those changes become visible — a dark speck, a yellowing edge, a patch that looks slightly off — the infection has been active for several days. In fast-moving diseases like Southern rust in corn, that window can be the difference between a fungicide that works and one that arrives too late to protect grain fill.
The four diseases that cause the most damage across U.S. row crops follow exactly this pattern, and all four are active across major production regions right now.
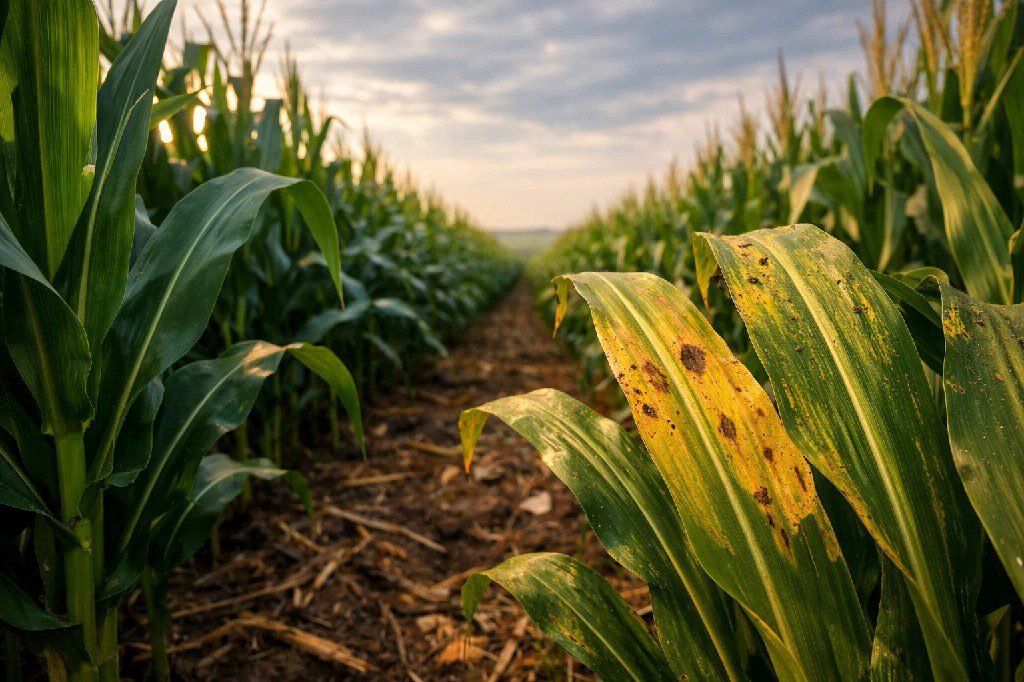
Tar spot in corn has expanded aggressively across the Midwest over the last five years, moving from early hotspots in Indiana and Illinois into Iowa, Ohio, and Michigan. The black, raised lesions look obvious once they’re there — but the spectral signature of an infected canopy starts changing before those lesions form. A field that looks clean on a Wednesday scout can have visible symptoms by the following Monday, especially under the humid conditions that favor the disease.
Southern rust in corn moves even faster. It travels north on storm systems from southern production areas, and once it arrives in a field, it can reach damaging severity levels in 10 to 14 days under warm, humid conditions. Catching it at the beginning of that window — not a week in — determines whether a fungicide application actually protects the crop.
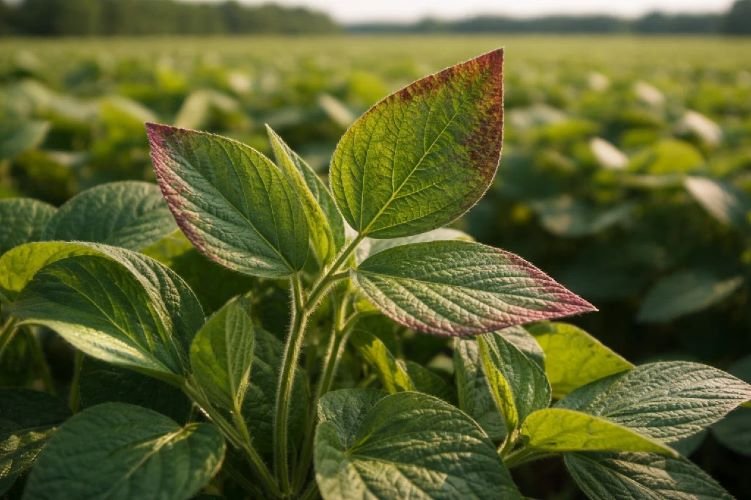
Cercospora leaf blight in soybean was the single largest cause of foliar soybean disease losses in the U.S. in 2024. It’s often confused with normal late-season senescence, which means it gets missed or written off until the damage is already done. Its early spectral changes are distinct enough to flag from satellite data before the leaves show the characteristic purple cast.
Septoria and Fusarium in wheat across the Northern Great Plains and Southeast follow the same trajectory — infection begins under conditions that precede any visible symptom by days, and timing of fungicide application relative to that infection window is the primary driver of whether the treatment pays.
Why Walking the Field Is No Longer Enough
Scouting is not the problem. An experienced agronomist walking a field with trained eyes is still one of the best tools in crop protection. The problem is geometry. A thorough scout can cover 200 to 300 acres in a full day of field walking. An operation of 3,000, 5,000, or 8,000 acres cannot be fully scouted before a fast-moving disease completes its first cycle and begins spreading.
What scouting gives you is confirmation of where the problem already is. What it can’t give you is coverage of every acre, every week, during the critical windows when early signs of crop disease are present but not yet visible. The acres that don’t get walked that week are the acres where the disease gets a head start.
Calendar-based fungicide applications try to solve this by protecting the field whether or not there’s a known threat. That works — but it means applying inputs uniformly across an entire field when the actual risk may be concentrated in specific zones. In a season where input costs are already stretched, that’s money spent on protection for ground that didn’t need it, while the zone that did need earlier attention got the same treatment at the same time.
| Approach | What It Covers | When It Detects a Problem | Key Limitation |
|---|---|---|---|
| Field scouting | Areas you physically walk | When symptoms are already visible | Can’t cover every acre every week |
| Calendar fungicide program | Entire field, uniformly | Applied on schedule, not on risk | Treats zones that may not need it |
| Weather-based disease models | Regional risk estimate | Flags conditions that favor disease | Doesn’t tell you which fields or zones are actually affected |
| SkyIntelGroup satellite analysis | Every acre of your operation | Spectral changes before visible symptoms | — |
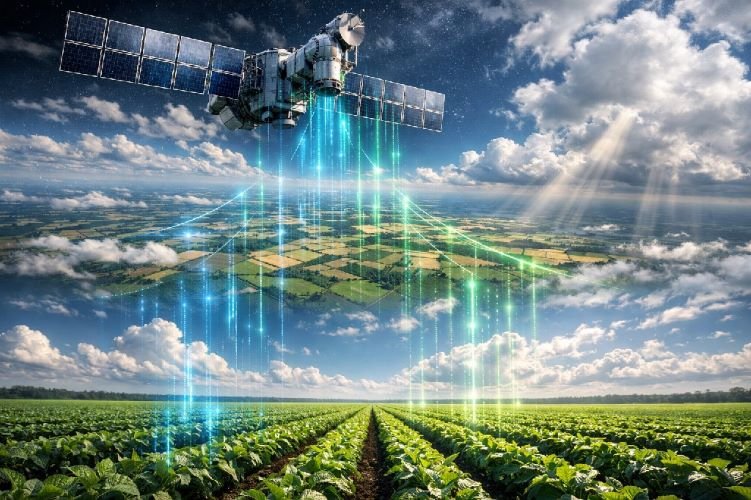
How Satellite Monitoring Detects Early Signs of Crop Disease in the United States
The satellite isn’t looking for spots on leaves. It’s looking at how the plant canopy across your entire field is behaving — and whether any zone is starting to behave differently from the rest.
Think of it this way. A healthy corn or soybean canopy reflects light in a predictable pattern across different wavelengths. When disease begins to affect a group of plants, that pattern starts to shift — chlorophyll activity changes, the canopy temperature rises slightly, the way moisture moves through the leaves alters. These shifts happen before the lesion forms, before the color changes, before any ground-level symptom is visible. They show up in satellite multispectral data as an anomaly — a zone that’s starting to diverge from both the surrounding field and from how that same zone was behaving a week or two earlier.
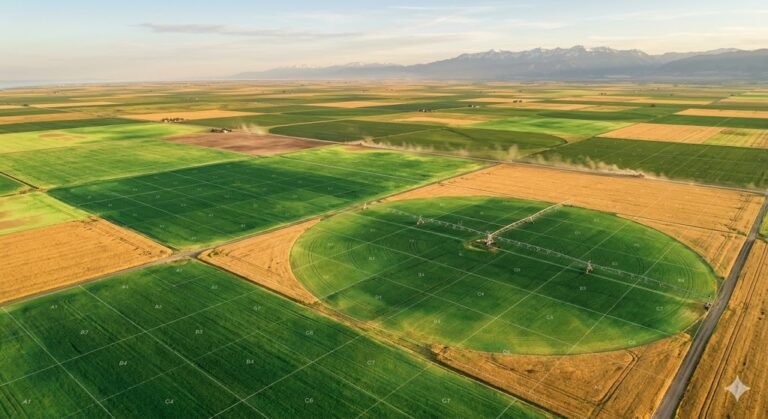
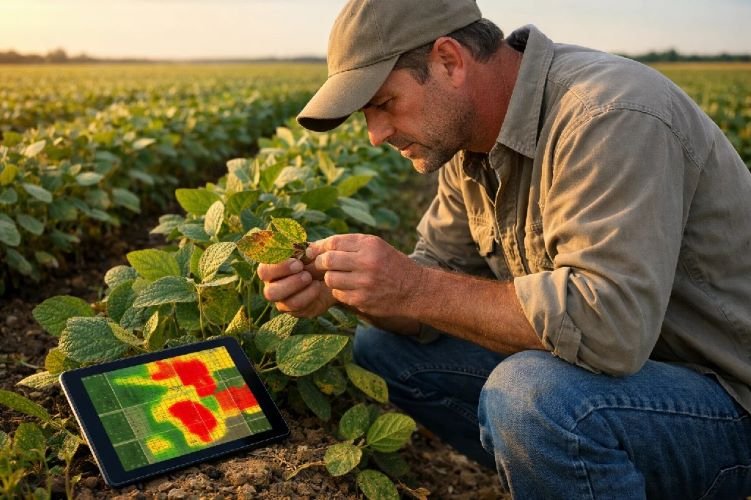
SkyIntelGroup processes that data and delivers a field map with a straightforward output: zones that are behaving normally, and zones where something is changing. The agronomist goes to the zones that are flagged. They confirm on the ground what the satellite indicated from above. They apply where it’s needed, at the time it’s needed — not across the whole field on a fixed schedule.
The process for U.S. farms is simple. Share the boundaries of your fields — a shapefile, coordinates, or just the location and approximate size. SkyIntelGroup identifies the best available recent imagery for your area, processes it against the historical baseline for those fields, and delivers the anomaly map. No hardware to install. No app to learn. No subscription platform to set up. The full range of what this covers by crop and region is available on SkyIntelGroup’s agriculture satellite intelligence services page.
Where Crop Disease Hits Hardest Across the United States
The early signs of crop disease in the United States don’t concentrate in one region — they follow wherever high-value crops grow under conditions that favor infection. But the damage profile is different by geography, and so is the intervention opportunity.
The Corn Belt — Iowa, Illinois, Indiana, Ohio, Minnesota is where the stakes are highest for row crop disease. Iowa and Illinois alone produce more than a third of U.S. corn. Tar spot has been expanding its range across this region for five consecutive seasons, and Southern rust arrives annually from the south with timing that’s hard to predict. Cercospora led soybean foliar disease losses across the northern states in 2024. Operations here routinely run 3,000 to 10,000 acres — the exact scale where full scouting coverage is impossible and satellite field-wide detection has the clearest impact.
The Southern Plains — Texas, Oklahoma, Kansas deal with a different disease mix: Southern rust in corn, Cotton root rot in cotton fields across Texas, nematode pressure in both corn and cotton. Texas recorded the highest agricultural losses of any U.S. state for the third consecutive year in 2024, exceeding $3.4 billion. In cotton, disease losses alone accounted for more than 827,000 bales nationally. The growing seasons here are longer and conditions for disease spread persist well into summer.
California and the Pacific Northwest face different crops and different pathogens. Powdery mildew in wine grapes and almonds, late blight in potatoes in Idaho and Oregon, Botrytis in strawberries and specialty crops in California. These are high-value crops where a missed disease window doesn’t just reduce yield — it can destroy the quality of the entire harvest in an affected zone.
| Region | Key Crops | Most Damaging Diseases (2024) | Risk Level |
|---|---|---|---|
| Corn Belt (IA, IL, IN, OH, MN) | Corn, soybeans | Tar spot, Southern rust, Cercospora leaf blight | CRITICAL |
| Southern Plains (TX, OK, KS) | Corn, cotton, wheat | Southern rust, Cotton root rot, nematodes | HIGH |
| Northern Great Plains (ND, SD, MT, KS) | Wheat, barley | Fusarium head blight, Septoria, stripe rust | HIGH |
| California / Pacific Northwest | Grapes, almonds, potatoes, specialty crops | Powdery mildew, late blight, Botrytis | ELEVATED |
What Changes When You Catch It 10 Days Earlier
The value of early detection comes down to one thing: timing determines whether your response protects the yield or just documents the loss.
Consider a farm manager in central Iowa running 4,000 acres of corn and soybean. Mid-July, conditions have been warm and humid — exactly what Tar spot favors. A satellite anomaly map flags a zone in the southeast corner of one of the corn fields: the canopy in that section is behaving differently from the rest of the field and from how it looked two weeks earlier. The agronomist goes to that section, confirms early Tar spot development on the lower canopy. The fungicide application goes there first, at the dose and timing that still protects grain fill. The rest of the field, which the analysis shows is still clean, gets monitored for another pass before any decision is made.
Two outcomes happen at once. The affected zone gets protected at the point where intervention still works. The clean zones don’t receive an application they didn’t need. Input cost is reduced. The yield in the flagged zone is protected through the grain fill period.
Compare that to the alternative: the scouting schedule didn’t hit that corner of the field until symptoms were already spreading. The fungicide gets applied five days later, across the whole field, after the disease has already progressed past the point where it will fully respond.
How SkyIntelGroup Works for U.S. Farm Operations
The process is simple by design. Share the boundaries of your fields — a shapefile, coordinates, or the name and location of the operation. SkyIntelGroup processes the most recent available satellite imagery for your area alongside the historical baseline for those specific fields, and delivers a zone-by-zone anomaly map showing where the canopy is behaving normally and where something is starting to change.
No hardware ships. No sensors get installed. No new platform to learn. The analysis comes back in the format your team already uses — PDF for field review, shapefile for GIS, or a structured report for the agronomist. The first analysis includes historical imagery context so you’re not just seeing today’s snapshot — you’re seeing whether a flagged zone is a new development or a recurring pattern tied to a specific part of the field.
This service is available for any crop in any U.S. state, at any operation scale. A 400-acre specialty crop grower in California and a 12,000-acre corn and soybean operation in Iowa use the same process — the scale of coverage adjusts to the operation.
Frequently Asked Questions About Early Crop Disease Detection
Can satellite monitoring tell me exactly which disease my crop has?
No, and it’s important to be clear about this. Satellite analysis detects that something is changing in a specific zone of your field — the spectral behavior of the canopy is shifting in a way that indicates a biological stress is underway. What it doesn’t do is identify the specific pathogen responsible. That confirmation still comes from the agronomist who goes to the flagged zone and looks at the plant. What the satellite gives you is the location and the timing — so the agronomist is going to the right place at the right moment, instead of discovering it after a full-field scout that may have come too late.
How much earlier than visual scouting can satellite analysis detect a problem?
It depends on the disease, the crop, and the conditions — but the spectral changes that indicate early infection typically precede visible symptoms by several days. For fast-moving diseases like Southern rust in corn, where the window between early infection and damaging severity can be as short as 10 to 14 days, detecting the problem even 5 to 7 days earlier can be the difference between a fungicide that arrives in time and one that doesn’t.
Does this work for smaller farming operations or only large ones?
It works for any scale of operation. The value scales with acreage — a farm with 400 acres gets coverage of every section it couldn’t physically scout every week; a farm with 8,000 acres gets coverage across its entire footprint at a cost that would be impossible with ground resources alone. There’s no minimum acreage requirement to work with SkyIntelGroup.
Which crops does this monitoring work best for?
It works across all major U.S. field crops — corn, soybeans, wheat, cotton — as well as specialty crops including wine grapes, almonds, potatoes, and other tree crops and vegetables. The strongest results come from crops where the spectral signature of early disease stress is distinct and where the intervention window is narrow, which is true for most of the highest-priority diseases in U.S. production.
How do I get started?
Contact SkyIntelGroup directly with your field boundaries, crop type, and the growth stage or time window you want covered. The team confirms what satellite coverage is available for your area, what historical data exists for your fields, and what monitoring frequency makes sense for your operation and crops. No software purchase, no onboarding process, no commitment before you see what the data shows for your specific fields.