Crop Water Stress in the United States: How Satellite Intelligence Is Saving Farms Before the Damage Shows (2026)
You’re irrigating. You have a schedule. You follow the USDA drought monitor. Some fields have sensors. And yet, at the end of every season, there are zones in your operation that underperformed — and you’re not entirely sure why.
The honest answer, in most cases, isn’t a broken pump or a bad season. It’s timing. Your crops were already under water stress during a critical growth window — days before any visible symptom appeared, days before anyone on the ground would have noticed — and by the time the signal was clear enough to act on, the yield loss was already locked in.
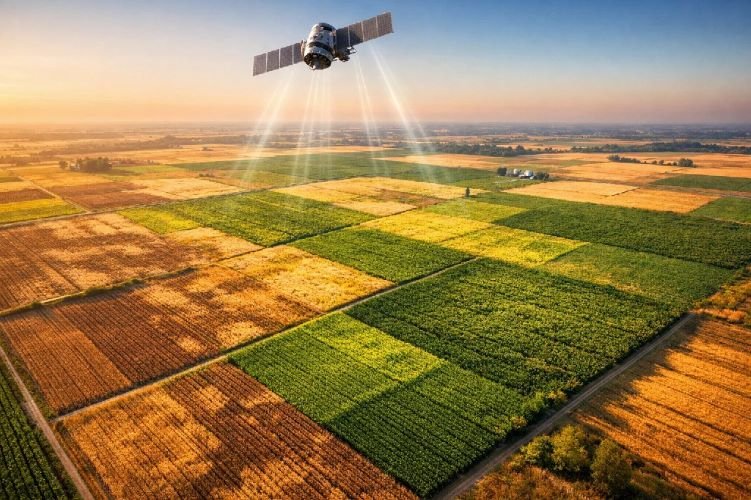
Crop water stress in the United States is rarely the dramatic story of a field dying in a drought. It’s the quieter, more expensive story of moderate, undetected stress accumulating during exactly the days that matter most. SkyIntelGroup was built to solve that problem — detecting stress across your entire operation from satellite imagery, before the damage shows on the ground.
The Real Cost of Crop Water Stress in the United States
Drought doesn’t have to be catastrophic to be expensive. In fact, the most costly version of crop water stress isn’t the headline-grabbing disaster year — it’s the slow, season-after-season loss that never makes the news because no single field collapses, it just consistently yields less than it should.
The numbers behind this are significant. Drought and excess moisture together account for more than 70% of all crop insurance indemnity payments in the United States between 2001 and 2016. Annual average agricultural losses from drought alone run between $10 and $14 billion. These aren’t figures from outlier catastrophe years — they represent the baseline cost of water mismanagement at scale, compounded across millions of acres.
The crop-level impact is equally specific. In corn, water stress during the pollination window can reduce yield by up to 9% per day of severe stress. In soybeans, the critical window runs from early pod set through mid seed fill. In almonds, pistachios, and wine grapes, stress during nut sizing or berry development directly determines the size and quality of what you harvest — and neither of those can be recovered with a late irrigation. By the time a field is visibly stressed, the biological clock has already moved past the point where full recovery is possible.
Why Your Fields Are Already Losing Yield Before You See Anything
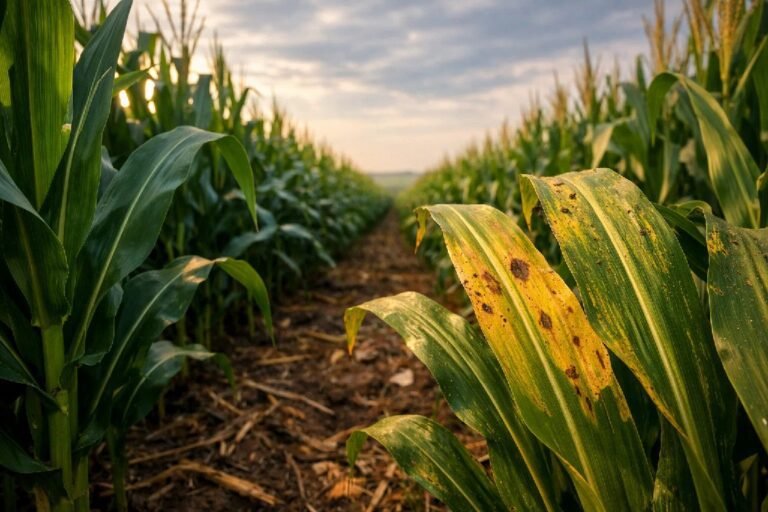
The biology of crop water stress works against the farmer. It starts invisibly, underground and inside the plant, days before any surface signal appears.
When a crop can’t pull enough water from the soil — whether because the soil is dry, the root zone is depleted, or the irrigation cycle missed a zone — the plant’s first response is to close its stomata, the microscopic pores on its leaves that control gas exchange. This is a survival mechanism. The plant is trying to conserve whatever water it has. But in doing so, it stops absorbing carbon dioxide, which means photosynthesis slows. Growth slows. Nutrient uptake slows. And because transpiration is also what cools the leaf, the plant’s canopy temperature rises — measurably, consistently, even under conditions that look perfectly normal from the road.
That temperature signature — that subtle heat rising from a stressed canopy — is detectable from satellite imagery days before the leaves begin to roll, days before the color shifts, days before any scout would flag it walking the rows. By the time the visual symptoms appear, the plant has already been under stress long enough that the critical window — the one where intervention would have protected yield — has often passed.
The problem with traditional monitoring isn’t effort or intention. It’s geometry. A soil sensor measures one point. A weather forecast tells you what water came down, not what the plant actually has access to. Visual scouting covers what you can physically reach. None of these gives you a complete picture of every acre, every zone, every irrigation block — at the exact moment when the stress is beginning, not after it’s already fully expressed.
Where Crop Water Stress in the United States Hits Hardest
Water stress doesn’t have a single geography. It follows wherever irrigated agriculture meets a tightening water supply — and in 2026, that describes more of the country than most buyers of crop insurance would like to admit.
California’s Central Valley is the most visible example. More than 8.2 million acres of irrigated cropland producing almonds, pistachios, table grapes, processing tomatoes, and leafy vegetables — crops whose value per acre makes every gallon of water applied a financial decision. Under SGMA, the Sustainable Groundwater Management Act, growers must demonstrate sustainable water use within their groundwater basin. That regulatory pressure makes undetected water stress doubly costly: yield lost and water wasted are both problems when your pumping allocations are being watched.
Nebraska, Kansas, and Colorado tell a different version of the same story. Corn and soybeans irrigated from the High Plains Aquifer, which has been in measurable decline for decades. As water tables drop and pumping restrictions tighten, the premium on knowing exactly where water is needed — not guessing based on calendar schedules — rises every season.
Texas runs the largest total irrigated acreage of any state, spread across cotton, sorghum, pecans, and vegetables. Drought is not an exception in Texas; it is a recurring operational condition. The question isn’t whether water will be scarce — it’s whether the grower will know early enough to respond.
The Pacific Northwest — Idaho, Oregon, Washington — depends heavily on snowmelt-fed surface water for potato, onion, hop, and tree fruit irrigation. Snowpack in the Cascades and Sierra Nevada has been declining. When the snowpack is shallow, early-season surface water allocations are cut, and growers are left making irrigation decisions with less water and less certainty about when the next delivery will arrive.
The broader context matters: irrigated cropland represents less than 17% of total harvested cropland in the United States, yet it generates more than 50% of the total value of U.S. crop sales. That 17% cannot operate on assumptions.
| State / Region | Key Crops | Main Water Pressure | Stress Risk Level |
|---|---|---|---|
| California (Central Valley) | Almonds, pistachios, grapes, tomatoes | SGMA restrictions, reduced snowpack, aquifer depletion | CRITICAL |
| Nebraska / Kansas / Colorado | Corn, soybeans, wheat | Ogallala Aquifer decline, pumping restrictions | HIGH |
| Texas | Cotton, sorghum, pecans, vegetables | Recurring drought cycles, largest irrigated area in the U.S. | HIGH |
| Idaho / Oregon / Washington | Potatoes, onions, apples, hops | Declining snowpack, early-season surface water cuts | ELEVATED |
| Midwest Corn Belt | Corn, soybeans | Mid-season dry spells, variable rainfall during grain fill | ELEVATED |
How Satellite Monitoring Detects Crop Water Stress in the United States Before You Do
This is where the conversation about crop water stress in the United States changes — from identifying the problem to actually solving it at the scale where farms operate.
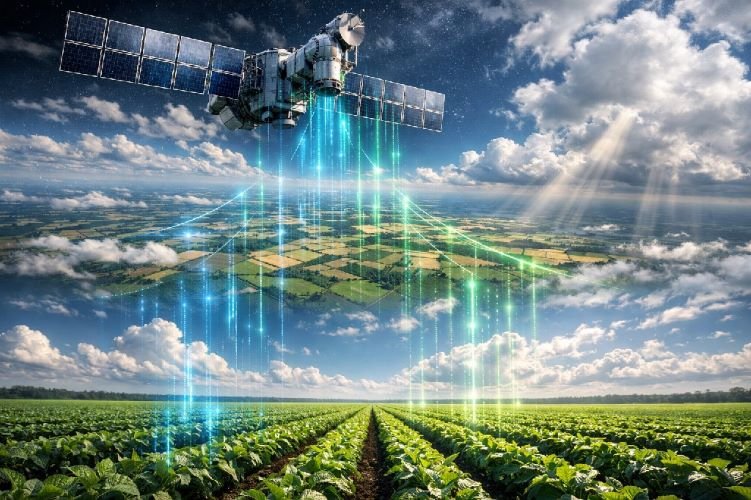
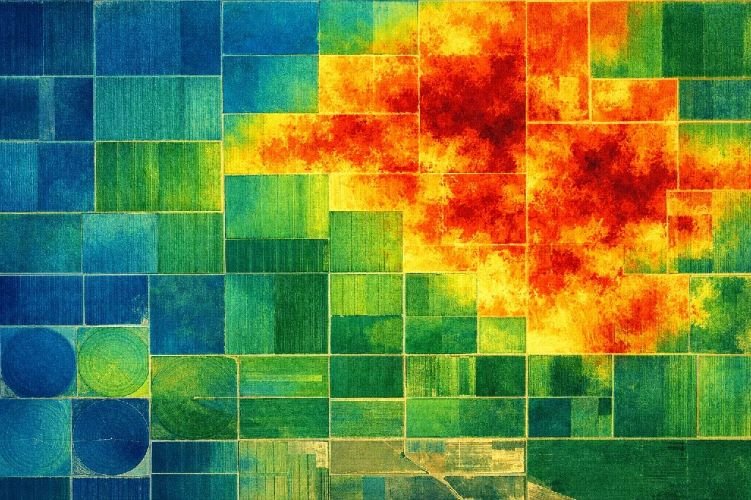
Satellite-based stress detection doesn’t work like a soil sensor. It doesn’t measure what’s underground. It measures the plant itself — its canopy temperature, its water content at leaf level, its photosynthetic activity. When a crop begins to close its stomata under water deficit, that closure produces a measurable thermal signature: the canopy gets warmer than a healthy, well-irrigated crop under the same conditions. Multispectral imagery captures the change in how the plant reflects near-infrared and shortwave infrared light — a shift that correlates directly with leaf water content and precedes visible wilting by days.
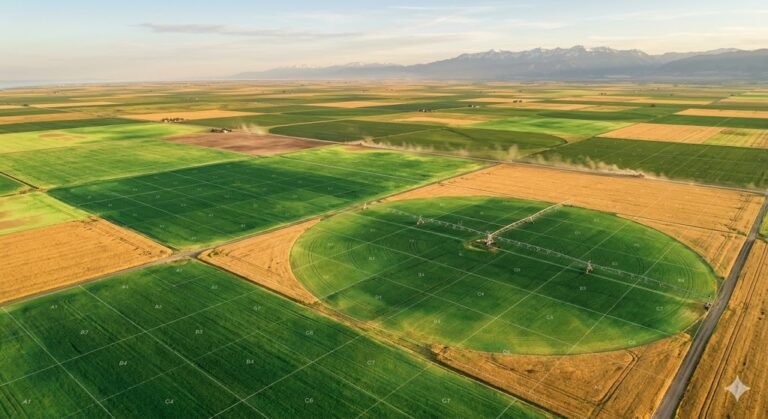
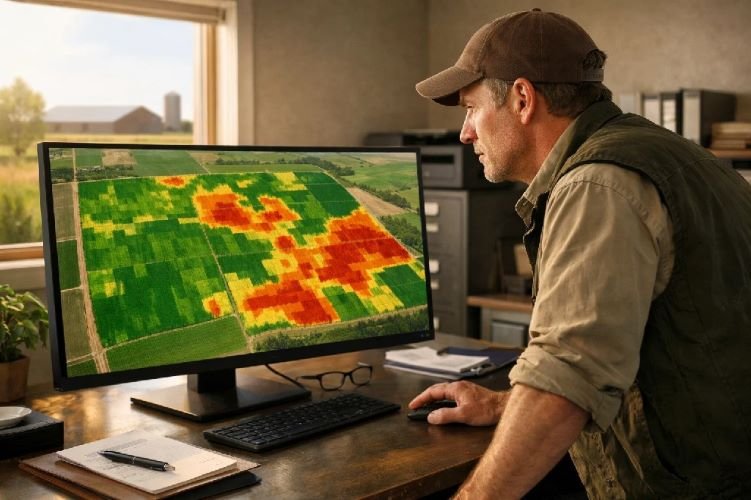
SkyIntelGroup combines multiple satellite data sources — including Sentinel-2 multispectral imagery and thermal bands from Landsat — to produce field-level stress maps showing exactly which zones of your operation are under stress, what the severity level is, and how that compares to the same fields at the same growth stage in prior seasons. The historical baseline is one of the most underused advantages of satellite monitoring: because Landsat imagery goes back decades, your first analysis already includes context about whether a stressed zone is a new problem or a recurring pattern tied to soil variability, irrigation system design, or field topography.
The service works for any field in any U.S. state, with no hardware installation, no sensor calibration, no software subscription. The client shares field boundaries and crop information; SkyIntelGroup processes the imagery and delivers the analysis in whatever format the operation already uses. For the full scope of what this covers by crop type and monitoring frequency, see SkyIntelGroup’s agriculture satellite intelligence services.
What Changes When You Catch the Stress Early
The value of early detection is not abstract. It shows up in two places: the yield you protect and the water you don’t waste.
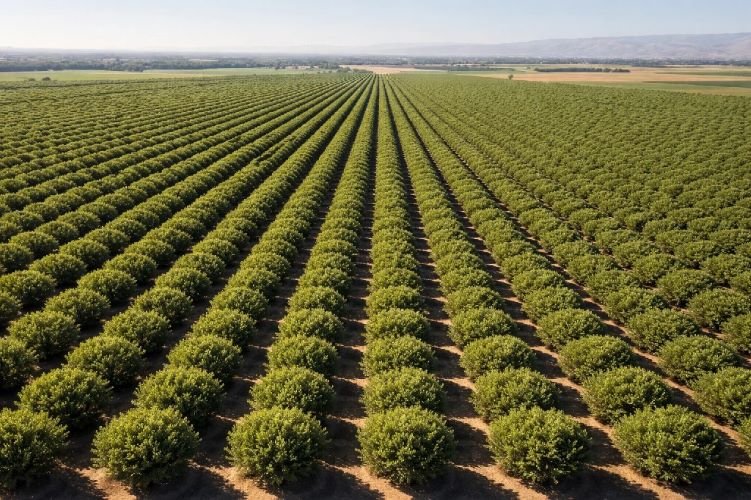
Consider a farm manager operating an almond orchard in the San Joaquin Valley. A satellite stress analysis delivered during hull split — one of the most water-sensitive periods in almond production — shows moderate thermal stress developing in the southern blocks of the orchard, while the northern blocks remain in good condition. Without that information, the standard irrigation schedule treats the field uniformly. With it, the manager redirects water to the stressed blocks and holds it from the blocks that don’t need it.
The result is two simultaneous wins: yield protection in the zone that was at risk, and water savings in the zones that were already adequate. Precision irrigation guided by actual field-level data — rather than uniform schedules or point-sensor extrapolation — consistently reduces water application by 15 to 30% compared to calendar-based approaches, while operations using satellite-informed management report yield improvements of 10 to 25% by avoiding undetected stress during critical windows.
For the U.S. farmer operating in 2026 with compressed margins, rising input costs, and water allocations that shrink every regulatory cycle, detecting stress 10 days early and detecting it 10 days late are not equivalent outcomes. One is a management decision. The other is a loss report.
Satellite vs. the Tools You’re Already Using
The question isn’t whether to replace what works. It’s about understanding what each tool actually sees — and what it leaves uncovered.
| Approach | What It Measures | Field Coverage | When Stress Is Detected | Key Limitation |
|---|---|---|---|---|
| Soil sensors | Moisture at installation point | Single point only | Real-time — but only there | Blind to everything outside the sensor location |
| Visual scouting | Visible plant symptoms | Where you walk | After damage is already done | Too late for recovery in critical windows |
| Weather forecasts | Expected rainfall / temperature | Regional average | Before the event — not plant response | Doesn’t tell you how the crop is actually responding |
| Calendar irrigation | Scheduled water delivery | Uniform across field | N/A — not monitoring | Assumes all zones have identical water needs |
| SkyIntelGroup satellite analysis | Plant stress signal across the entire field | Every acre, every zone | Days before visible symptoms | — |
Soil sensors and visual scouting are not wrong tools — they’re incomplete tools when used alone. A sensor tells you what’s happening exactly where it’s placed. Satellite analysis tells you what’s happening everywhere, and directs you to where the sensors and the boots should go next.
How SkyIntelGroup Delivers Crop Water Stress Monitoring for U.S. Farms
The process is straightforward by design. Share the boundaries of your fields — coordinates, a shapefile, or simply the location and approximate size. SkyIntelGroup identifies the most recent cloud-free satellite imagery available for your area, processes it against historical baselines, and delivers a zone-by-zone stress map with severity classification and temporal context.
No hardware ships. No installation crew visits. No seasonal sensor retrieval. The first analysis can include years of historical imagery, so from day one the client understands not just what is stressed today, but whether that zone has been a chronic problem or a new development.
Delivery format adapts to what the operation already uses: shapefile for GIS integration, georeferenced PDF for field teams, GeoTIFF for software platforms, or a structured report for management review. The analysis is available for any crop, any scale, and any U.S. state — SkyIntelGroup operates remotely and serves operations from a few hundred acres of specialty crops to multi-state row crop enterprises.
Frequently Asked Questions About Crop Water Stress Monitoring
Does satellite monitoring replace my soil sensors or irrigation system?
No, and it’s not designed to. Soil sensors measure moisture at the point where they’re installed — that data is precise and valuable. Satellite monitoring covers every acre of your field, including all the zones where you have no sensors. The two approaches complement each other: satellite analysis identifies where in the field you need to look more closely or act first; sensors and physical inspection confirm what’s happening at ground level in that specific zone. Think of it as the difference between checking the temperature in one room and having a thermal map of the entire building.
How often can I receive updated stress maps during the growing season?
Update frequency depends on satellite pass schedules and cloud cover over your fields. Under favorable conditions, updated analysis can be delivered every few days during the growing season. SkyIntelGroup works with multiple satellite data sources — including SAR-based imagery that operates through cloud cover — to maximize coverage continuity even during overcast periods, which is particularly relevant in the Pacific Northwest and parts of the Midwest.
Does this work for both irrigated and rainfed operations?
Yes, though the application differs. Irrigated operations use stress maps to direct where and when to apply water, converting monitoring data directly into irrigation decisions. Rainfed operations use the analysis to identify which zones are accumulating the most stress during dry periods, prioritize any available supplemental water, and document stress events for crop insurance verification purposes.
What crops does crop water stress monitoring work best for?
High-value specialty crops — almonds, pistachios, wine grapes, processing tomatoes, potatoes — typically see the fastest return because the financial cost of a missed stress event in a critical window is highest for these crops. That said, the analysis is equally applicable to corn, soybeans, wheat, and cotton, where large total acreage makes complete field coverage impractical through any other means.
How do I start a monitoring program for my operation?
Contact SkyIntelGroup directly with your field boundaries, crop type, and the growth stage or calendar window you want covered. The team will confirm what satellite coverage is available for your area, what historical data exists for your fields, and what the most useful monitoring frequency would be for your crop and operation size. No software purchase, no platform onboarding, no commitment before you see what the data shows.