Transmission Line Inspection: Drone and Satellite Technologies for Grid Reliability in 2026
The American Society of Civil Engineers delivered a sobering assessment in 2025: the United States energy infrastructure earned a D+ grade, down from C- just four years earlier. Behind this failing grade lies a network of 600,000 miles of transmission lines, 70% of power transformers exceeding 25 years of age, and grid components originally built in the 1950s and 1960s that have long surpassed their 50-year design life. With electricity demand projected to double from 17 GW in 2022 to 35 GW by 2030—driven by electric vehicles, data centers, and AI infrastructure—the pressure on aging transmission systems has never been greater.
Traditional transmission line inspection methods are failing to keep pace. Manual tower inspections cost approximately $5,000 per structure and require several days to complete. Helicopter patrols run $1,200 to $1,600 per mile with daily operational costs reaching $30,000. Meanwhile, approximately 50 utility line workers die on the job each year, and the industry faces a looming workforce crisis as 40% of current utility workers approach retirement eligibility by 2030.
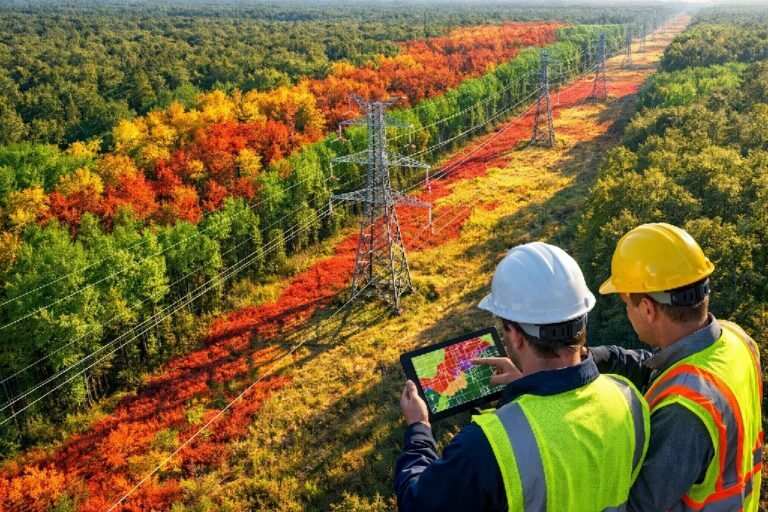
The solution lies in remote sensing technologies that are transforming how utilities monitor their most critical assets. Drone-based inspection programs have demonstrated 60% cost reductions while detecting four times more critical defects than traditional methods. Satellite imagery enables inspection of 100,000+ miles of corridors in days rather than months. AI-powered defect detection reduces the 17% error rate of manual inspection to below 5%.
SkyIntelGroup delivers transmission line inspection intelligence that combines satellite screening, drone-captured imagery, and thermal diagnostics into actionable insights—without the subscription lock-in of enterprise SaaS platforms. For utilities seeking to modernize inspection programs while maintaining budget flexibility, our consultive approach provides the expertise and deliverables needed to improve grid reliability and extend asset life.
The $6 Billion Inspection Challenge Facing U.S. Utilities
The scale of the transmission inspection challenge becomes clear when examining the numbers. Understanding the infrastructure baseline and the true costs of legacy inspection methods reveals why utilities are actively seeking technological alternatives.
Aging Infrastructure at Critical Mass
The U.S. transmission network operates under unprecedented strain. More than 640,000 miles of high-voltage transmission lines currently function at or near maximum capacity, with most components dating to an era when household electricity consumption averaged under 100 kWh annually—compared to over 10,000 kWh today.
The ASCE reports that 28,000+ miles of new transmission development is anticipated over the next decade, significantly higher than the 18,675-mile estimate from just one year prior. This expansion occurs against a backdrop of existing infrastructure desperately needing replacement. The majority of bulk transmission systems were constructed with 50-year life expectancies that have now been exceeded, creating compounding maintenance demands that traditional inspection methods cannot address efficiently.
Electricity demand growth has reached its highest levels in two decades. The proliferation of electric vehicles, expansion of data centers supporting artificial intelligence workloads, and electrification of building systems will require utilities to double existing transmission capacity to connect new renewable generation sources and meet consumer demand.
The True Cost of Manual Inspection Methods
Legacy inspection approaches impose significant financial and operational burdens on utilities. Helicopter-based transmission line inspection costs between $1,200 and $1,600 per mile according to Xcel Energy data, with daily operational rates ranging from $4,000 to $30,000 depending on crew size and mission complexity. A fully equipped inspection helicopter represents a capital investment exceeding $2 million before accounting for pilot training, maintenance, fuel, and insurance.
Ground-based manual inspections present their own challenges. Inspecting a single transmission tower using conventional climbing methods costs approximately $5,000 and requires several days to complete. The labor intensity of these inspections limits coverage—utilities simply cannot afford to inspect every structure with the frequency that aging infrastructure demands.
The human cost compounds the financial burden. Weather-related events account for 80% of electricity outages since 2000, with the majority occurring in the last decade. When outages strike, inspection crews face pressure to assess damage quickly under hazardous conditions. Distribution infrastructure, where 92% of all electric service interruptions occur, presents particularly challenging inspection environments with vegetation, confined spaces, and energized equipment creating constant safety concerns.
How Remote Sensing Technologies Transform Transmission Inspection
Modern power line inspection technologies address the limitations of legacy methods through complementary capabilities. Each sensor type captures different information, and the most effective inspection programs integrate multiple data sources for comprehensive asset assessment.
High-Resolution Visual and Thermal Imaging
Drone-mounted RGB cameras capture imagery at resolutions reaching 0.3 centimeters per pixel, enabling detection of hairline cracks, minor corrosion, and hardware defects invisible from ground level or helicopter distance. Standardized flight paths ensure consistent coverage across structures, eliminating the variability inherent in manual visual inspection.
Thermal imaging power lines reveals problems that optical cameras cannot detect. Infrared sensors identify temperature differentials indicating electrical resistance, failing connections, or component degradation. Thermal signatures vary by defect type:
Low-value insulators exhibit elevated temperatures due to reduced insulation resistance and increased current leakage. These partially degraded components generate measurable heat that thermal cameras detect before complete failure occurs.
Zero-value insulators have lost insulation properties entirely, showing minimal heat generation as current bypasses the failed component. Identifying these requires comparing thermal profiles across insulator strings rather than looking for hotspots.
Contaminated insulators accumulate surface pollution that creates conductive paths, resulting in leakage current and localized heating patterns distinct from internal degradation.
Temperature differentials exceeding 10°C between phases at the same load typically warrant immediate investigation. Thermal inspection programs that establish baseline temperature profiles enable trending analysis that predicts failures before they cause outages.
LiDAR for 3D Modeling and Structural Analysis
Light Detection and Ranging technology captures precise three-dimensional measurements of transmission infrastructure and surrounding environments. LiDAR transmission corridor mapping achieves centimeter-level accuracy for applications including:
Vegetation clearance verification measures exact distances between conductors and nearby trees, identifying encroachment before contact occurs. LiDAR penetrates forest canopy to map understory vegetation that optical sensors cannot see.
Structural deformation detection identifies tower lean, foundation settlement, and conductor sag that may indicate developing problems. Comparing LiDAR scans over time quantifies movement rates and helps prioritize remediation.
Digital twin creation generates accurate 3D models for engineering analysis, load calculations, and maintenance planning without requiring field visits for every assessment.
China Southern Power Grid demonstrated LiDAR inspection efficiency on their Yunnan-Guizhou interconnection project. Using drone-mounted LiDAR systems, crews scanned 52 kilometers of lines and 142 towers in just 2 hours. The 33.7 GB point cloud dataset was processed and ready for analysis within 56 minutes, enabling same-day identification of clearance issues and structural concerns.
Satellite Imagery for Wide-Area Screening
Satellite-based monitoring addresses scale challenges that neither drones nor helicopters can efficiently solve. Where drone programs measure coverage in miles per day, satellite systems assess 100,000+ miles of transmission corridors in days rather than weeks or months.
Very high resolution (VHR) satellite imagery at 30-50 centimeter resolution supports asset mapping, change detection, and vegetation monitoring across entire service territories. Spectral analysis identifies stressed vegetation, thermal anomalies at substation scale, and environmental changes that may affect transmission infrastructure.
Satellite monitoring requires no regulatory permits, flight coordination, or equipment deployment. Data acquisition occurs automatically based on orbital schedules, providing consistent temporal coverage for trend analysis. When combined with AI-powered change detection algorithms, satellite screening identifies locations requiring detailed drone inspection—dramatically improving the efficiency of field resources.
Defect Types Detected by Remote Inspection Systems
Different inspection technologies excel at detecting different defect categories. Understanding which sensors address which problems enables utilities to design inspection programs that comprehensively assess asset condition.
| Defect Category | Specific Issues | Optimal Detection Method | Severity Impact |
|---|---|---|---|
| Structural | Cracked insulators, missing caps, broken hardware, damaged conductors | RGB camera + AI classification | Critical — flashover risk |
| Thermal | Hotspots, loose connections, overloaded conductors, failing splices | Thermal IR imaging | High — fire/failure risk |
| Corrosion | Tower rust, fitting degradation, coating loss, galvanic corrosion | RGB + multispectral analysis | Medium-High — structural integrity |
| Vegetation | Encroachment, strike trees, clearance violations, growth rate changes | LiDAR + satellite NDVI | High — outage/wildfire risk |
| Foundation | Settlement, cracking, erosion, anchor degradation | LiDAR + InSAR monitoring | Critical — collapse risk |
AI-Powered Defect Detection and Classification
Computer vision algorithms trained on transmission infrastructure imagery automate defect identification at scale. Research demonstrates detection accuracy reaching 93.5% for insulator defects including cracks, missing caps, and contamination patterns. Production systems from providers like Optelos have processed over 675,000 images across 267 project sites, demonstrating enterprise-scale capability.
AI defect detection delivers measurable improvements over manual analysis. Manual inspection processes exhibit an estimated 17% error rate due to fatigue, image quality issues, inconsistent lighting, and human attention limitations. AI-assisted inspection reduces this error rate to below 5% while dramatically increasing throughput.
Automated severity scoring prioritizes maintenance response. Rather than treating all identified defects equally, machine learning models assess failure probability and consequence severity to rank issues by urgency. Integration with computerized maintenance management systems (CMMS) enables automatic work order generation, routing repair crews to precise GPS coordinates with defect imagery and recommended actions.
Cost-Benefit Analysis: Helicopter vs Drone vs Satellite
Budget-conscious utilities need clear cost comparisons to justify inspection technology investments. Direct cost data from industry sources enables informed decision-making about which technologies to deploy for different inspection requirements.
Direct Cost Comparison Per Mile
| Method | Cost per Mile | Cost per Tower | Daily Rate | Equipment Investment |
|---|---|---|---|---|
| Helicopter | $1,200–$1,600 | — | $4,000–$30,000 | >$2M |
| Drone (BVLOS) | $200–$300 | $150–$500 | $2,000–$5,000 | $250K or less |
| Drone (service provider) | $300–$2,000 | $150–$500 | Varies by scope | $0 (outsourced) |
| Satellite | $0.50–$2.00 | — | Subscription-based | $0 (data purchase) |
| Manual climbing | — | ~$5,000 | Limited by crew | Training + equipment |
Navigant Research documented the dramatic cost differential for individual structure inspection: tower inspection costs dropped from $5,000 to $200 when transitioning from manual climbing to drone-based methods—a 96% reduction.
When to Use Each Technology
The optimal inspection program deploys each technology where its capabilities provide maximum value:
Satellite imagery excels at initial screening, vegetation trend monitoring, and regional prioritization. Post-storm damage assessment across entire service territories becomes practical when satellites capture imagery within hours of weather events. Monthly or quarterly satellite monitoring establishes baselines for change detection without field deployment costs.
Drone inspection delivers detailed structural and thermal assessment of prioritized corridors. A three-person drone team can inspect approximately 14 miles of transmission line per day, averaging seven minutes per tower for comprehensive RGB and thermal capture. Drones access structures that are difficult or dangerous for climbing crews while capturing imagery from angles impossible to achieve from the ground.
Helicopter inspection remains valuable for emergency rapid response and extremely remote areas where drone logistics become prohibitive. Combined crew transport and inspection missions may justify helicopter costs when personnel must travel to remote sites regardless.
Ground patrol validates issues flagged by remote inspection, verifies repairs, and addresses defects requiring physical intervention. Rather than conducting comprehensive inspections, ground crews focus on confirmed problems identified by remote sensing analysis.
Transform Your Transmission Inspection Program
Discover how satellite and drone technologies can reduce your inspection costs by 60% while detecting more defects than traditional methods. Our experts will assess your infrastructure and recommend the optimal multi-sensor approach for your grid.
Real-World ROI: Utility Case Studies
Documented implementations demonstrate the quantifiable benefits utilities achieve through modern transmission tower inspection programs. These case studies represent different utility sizes and inspection scopes, illustrating scalable results.
Georgia Power — 60% Cost Reduction
Georgia Power’s transition from ground crews and manned aircraft to drone-based inspection delivered dramatic improvements across multiple metrics. The utility achieved approximately 60% reduction in annual inspection costs while simultaneously improving defect detection rates.
More significantly, the drone program identified four times more critical issues than traditional inspection methods had detected. Defects that manual inspection missed—or that developed between infrequent inspection cycles—became visible through systematic drone coverage with AI-assisted analysis. Earlier detection enabled preventive maintenance rather than emergency response, further reducing total lifecycle costs.
Fortune 500 Utility with Optelos Platform
A major utility partnership with Optelos demonstrates enterprise-scale implementation results. The program processed over 675,000 images across 267 project sites, analyzing 3.2 terabytes of inspection data through AI-powered defect detection algorithms.
Integration with the utility’s trouble ticketing system enabled automated work order generation when AI identified defects requiring attention. This workflow automation achieved 70% reduction in remediation time from defect detection to repair completion. Despite no increase in inspection personnel, the utility realized a 3x increase in inspection capacity—covering more infrastructure more frequently with the same team.
China Southern Power Grid — LiDAR at Scale
China Southern Power Grid’s pilot project on the Yunnan-Guizhou interconnection channel demonstrated LiDAR inspection efficiency at transmission scale. The 1,283-kilometer corridor connecting three provinces represented a significant test of drone-based LiDAR capabilities.
Test sections covering 52 kilometers of lines and 142 towers were completely scanned in just 2 hours using the CW-25E drone platform with JoLiDAR-LR22S sensor. The 33.7 GB raw point cloud dataset was processed within 50 minutes after upload, enabling same-day analysis of clearance issues and structural concerns. This efficiency enables inspection frequencies that would be economically impossible with traditional methods.
The Multi-Tiered Inspection Workflow
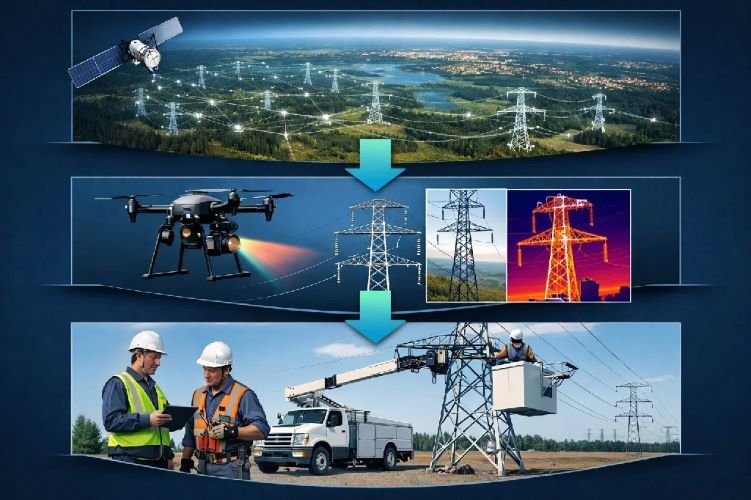
Effective overhead line inspection programs integrate multiple technologies into systematic workflows that maximize efficiency while ensuring comprehensive coverage. The tiered approach directs resources where they provide greatest value.
Tier 1 — Satellite-Based Regional Screening
Satellite monitoring establishes the foundation for prioritized inspection programs. Coverage of entire service territories occurs within days, identifying areas of change and elevated risk without any field deployment.
Change detection algorithms compare current imagery against historical baselines to identify new construction, vegetation growth, or environmental changes affecting transmission corridors. Spectral analysis monitors vegetation health along rights-of-way, flagging areas where growth rates suggest near-term encroachment risk.
Post-event assessment following storms, wildfires, or other incidents enables rapid damage identification across affected areas. Rather than dispatching crews to patrol entire regions, satellite imagery directs response to confirmed damage locations.
Recommended frequency: Monthly monitoring for baseline trending, with on-demand tasking following significant weather events.
Tier 2 — Drone Inspection of Priority Corridors
Satellite screening identifies corridors requiring detailed assessment. Drone teams then capture high-resolution RGB, thermal, and LiDAR data on prioritized structures.
Operational experience demonstrates that a three-person drone team can inspect approximately 14 miles of transmission line per day, averaging seven minutes per tower for comprehensive multi-sensor capture. Automated flight planning ensures consistent coverage and enables comparison across inspection cycles.
AI processing identifies defects in captured imagery, classifying issues by type and severity. Automated reporting generates georeferenced defect logs with GPS coordinates, defect imagery, and recommended actions—ready for integration with asset management systems.
Recommended frequency: Annual comprehensive inspection of all transmission structures, with quarterly inspection of high-risk corridors identified through satellite screening.
Tier 3 — Ground Validation and Repair
Remote inspection identifies issues; ground crews resolve them. Rather than conducting broad patrol inspections, field personnel focus on confirmed problems identified and prioritized through remote analysis.
Crews arrive at specific structures with detailed defect information, imagery showing the issue, and recommended repair procedures. This targeted approach eliminates time spent searching for problems and ensures appropriate equipment and materials are on-site for efficient resolution.
Documentation of completed repairs feeds back into asset management systems, closing the loop and establishing verified condition records. Historical defect and repair data enables predictive maintenance modeling that anticipates future failures based on degradation patterns.
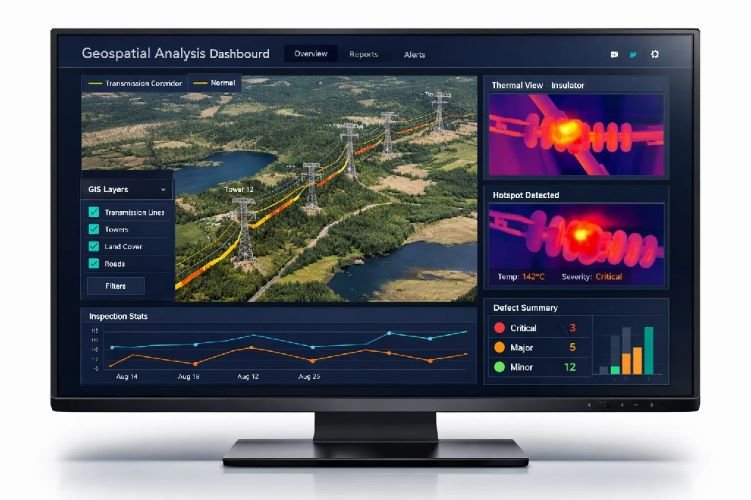
Integration with Asset Management and GIS Systems
Inspection data delivers maximum value when integrated with existing utility systems. GIS-ready deliverables and automated workflows transform inspection findings into maintenance actions.
GIS-Ready Deliverables
Modern transmission line inspection programs produce georeferenced outputs compatible with enterprise GIS platforms. Every identified defect includes precise GPS coordinates, enabling direct plotting on utility maps and integration with asset records.
Esri ArcGIS integration allows inspection findings to populate directly into utility geospatial databases. Defect layers overlay existing infrastructure mapping, providing visual context for maintenance planning. Historical inspection data enables spatial analysis of defect patterns across the network.
Digital twin creation combines LiDAR point clouds, imagery, and asset data into navigable 3D models of transmission infrastructure. Engineers can virtually inspect structures, measure clearances, and plan modifications without field visits—accelerating project planning while reducing travel costs.
Automated Work Order Generation
Integration with computerized maintenance management systems (CMMS) automates the path from defect detection to repair dispatch. AI-assigned severity scores drive prioritization, ensuring critical issues receive immediate attention while lower-priority findings enter scheduled maintenance queues.
Work orders generated from inspection findings include defect location, imagery, classification, and recommended actions. Crews receive complete information before traveling to sites, improving first-visit resolution rates and reducing repeat trips.
Mean-time-to-repair metrics improve when the gap between detection and action shrinks. Utilities implementing automated workflows report 60-70% reductions in remediation time compared to manual inspection-to-work-order processes.
How SkyIntelGroup Delivers Transmission Line Intelligence
SkyIntelGroup approaches transmission tower inspection as a consulting engagement rather than a software subscription. This model provides utilities with expert analysis and actionable deliverables without long-term platform commitments.
Multi-Sensor Data Fusion
Our inspection programs integrate multiple data sources to provide comprehensive infrastructure assessment. Satellite imagery establishes regional context and identifies priority areas. Drone-captured RGB, thermal, and LiDAR data delivers detailed structural and condition information. The combination produces insights neither technology achieves alone.
Sensor selection matches client requirements. Utilities with existing drone programs receive analysis services for their captured data. Organizations without internal drone capabilities receive full-service inspection including flight operations. Satellite monitoring subscriptions scale from single-corridor focus to territory-wide coverage based on infrastructure scope.
This flexibility eliminates hardware lock-in. As sensor technologies evolve, clients benefit from improved capabilities without stranded equipment investments.
Consultive Approach vs SaaS Lock-In
Enterprise inspection platforms typically require multi-year subscriptions, per-seat licensing, and proprietary data formats that create switching costs. Utilities become dependent on specific vendors for ongoing access to their own inspection data.
SkyIntelGroup delivers format-agnostic outputs compatible with any GIS platform. Georeferenced defect reports, point cloud datasets, and thermal analysis packages integrate directly with existing utility systems. Clients own their data outright, with no ongoing fees required for access.
Our expert analysts interpret inspection findings and provide prioritized recommendations rather than simply delivering raw data. This consultive model proves particularly valuable for utilities without dedicated remote sensing expertise, translating technical outputs into maintenance-actionable intelligence.
Scalable Solutions for Any Grid Size
Inspection requirements vary dramatically across the utility sector. Rural cooperatives managing hundreds of miles of distribution lines face different challenges than investor-owned utilities responsible for multi-state transmission networks.
SkyIntelGroup scales engagement scope to match client needs. Project-based inspections address immediate assessment requirements without ongoing commitments. Recurring monitoring programs establish systematic inspection cycles with consistent methodology and trending analysis. Regional pilots demonstrate value before territory-wide deployment.
Pricing reflects actual area of interest rather than user counts or platform tiers. This structure enables predictable budgeting aligned with inspection scope rather than organizational size.
Implementation Roadmap for Utilities
Transitioning from legacy inspection methods to technology-enabled programs requires structured implementation. Phased deployment manages risk while demonstrating value at each stage.
Phase 1 — Baseline Assessment (Months 1-2)
Initial satellite analysis covers the entire service territory, establishing current infrastructure mapping and identifying areas of elevated risk. Comparison against existing inspection records reveals coverage gaps and validates known problem areas.
Vegetation encroachment analysis flags corridors requiring near-term attention. Change detection identifies structures or areas that have experienced modification since previous inspection cycles. This regional screening prioritizes subsequent detailed inspection without field deployment.
Gap analysis documents differences between current inspection capabilities and identified needs. The assessment provides foundation for business case development and implementation planning.
Phase 2 — Pilot Program (Months 3-4)
Pilot deployment targets 50-100 miles of prioritized transmission corridor for comprehensive drone and thermal inspection. Scope includes both known problem areas and representative sections of standard infrastructure.
AI defect detection processes captured imagery, with results validated against field verification. This validation establishes accuracy baselines for the specific infrastructure types and conditions present in the utility’s territory.
ROI measurement compares pilot costs and findings against historical inspection performance on the same corridors. Documented improvements in defect detection rates, cost per mile, and inspection cycle time support expansion justification.
Phase 3 — Full Deployment (Months 5-12)
Based on pilot results, inspection programs expand to cover entire transmission infrastructure. Systematic scheduling ensures all structures receive inspection within defined cycles, with high-risk areas inspected more frequently.
Integration with asset management systems enables automated workflow from defect detection through work order generation and repair verification. Historical data accumulation supports trending analysis and predictive maintenance model development.
Ongoing satellite monitoring maintains awareness of vegetation growth, environmental changes, and corridor conditions between detailed inspection cycles. This continuous oversight enables proactive response to developing issues rather than reactive discovery during scheduled inspections.
Frequently Asked Questions
How often should transmission lines be inspected?
NERC reliability standards require annual inspection of transmission facilities, establishing a minimum frequency baseline. However, optimal inspection cycles depend on infrastructure age, environmental exposure, historical defect rates, and consequence severity. High-risk corridors—including lines in wildfire zones, areas with severe weather exposure, or aging infrastructure segments—benefit from quarterly satellite monitoring combined with semi-annual detailed drone inspection. Remote sensing technologies enable increased inspection frequency without proportional cost increases, making risk-based inspection cycles economically practical.
Can satellite imagery detect small defects like cracked insulators?
Current commercial satellite imagery at 30-50 centimeter resolution cannot detect small component defects such as hairline cracks in insulators or missing hardware. Satellite technology excels at wide-area screening for vegetation encroachment, structural changes visible at tower scale, and thermal anomalies at substation facilities. The most effective inspection programs use satellite for regional prioritization—identifying corridors requiring detailed assessment—then deploy drone-mounted cameras for component-level inspection. This tiered approach maximizes efficiency by directing detailed inspection resources to areas of greatest concern.
What is the accuracy of AI-powered defect detection?
Production AI systems for transmission infrastructure inspection achieve 90-95% accuracy for common defect categories including damaged insulators, missing hardware, corrosion, and vegetation encroachment. Research implementations have demonstrated 93.5% detection accuracy for insulator defects specifically. This performance compares favorably to the estimated 17% error rate of manual visual inspection, which suffers from fatigue, inconsistent image quality, and attention limitations. However, AI performs best as a force multiplier for human expertise rather than a complete replacement. Flagged defects undergo validation by qualified inspectors before generating maintenance actions, ensuring critical decisions incorporate professional judgment.
How does thermal imaging detect transmission line problems?
Thermal cameras detect infrared radiation that correlates with temperature, revealing heat patterns invisible to standard cameras. Electrical problems generate characteristic thermal signatures: loose connections exhibit elevated temperatures due to increased contact resistance; corroded fittings show localized heating from current flow through degraded paths; overloaded conductors display temperature rises along their length. Different insulator defect types produce distinct patterns—partially degraded insulators run hot due to leakage current, while fully failed insulators may appear cooler as current bypasses them entirely. Temperature differentials exceeding 10°C between phases typically warrant investigation, though specific thresholds vary based on loading conditions and ambient temperature.
What ROI can utilities expect from remote inspection programs?
Documented implementations demonstrate substantial returns across multiple metrics. Georgia Power achieved approximately 60% reduction in annual inspection costs while detecting four times more critical issues than traditional methods. Navigant Research documented tower inspection costs decreasing from $5,000 to $200—a 96% reduction—when transitioning from manual climbing to drone-based methods. Major utilities using AI-powered analysis platforms report 70% reduction in remediation time and 3x increases in inspection capacity without additional personnel. Beyond direct cost savings, utilities benefit from improved SAIDI/SAIFI reliability metrics, reduced liability exposure through documented inspection records, and extended asset life through earlier defect detection enabling preventive rather than reactive maintenance.
Ready to Modernize Your Transmission Inspection Program?
SkyIntelGroup combines satellite intelligence, drone inspection, and thermal analysis to deliver comprehensive transmission line assessment—without enterprise platform lock-in. Contact our utility infrastructure team to discuss your inspection challenges and explore solutions scaled to your grid.